Figure 2
[Absorbance after ammonia adsorption] − [Absorbance before ammonia adsorption] at elevated temperatures. Thick black lines show the spectra at 373, 473, 573, 673 and 773 K, and the thin lines show the spectra at 10 K of the interval. The thick black line at the most upper position in 2500−3300 cm−1 region is the spectra at 373 K.
IRZ-FAU001
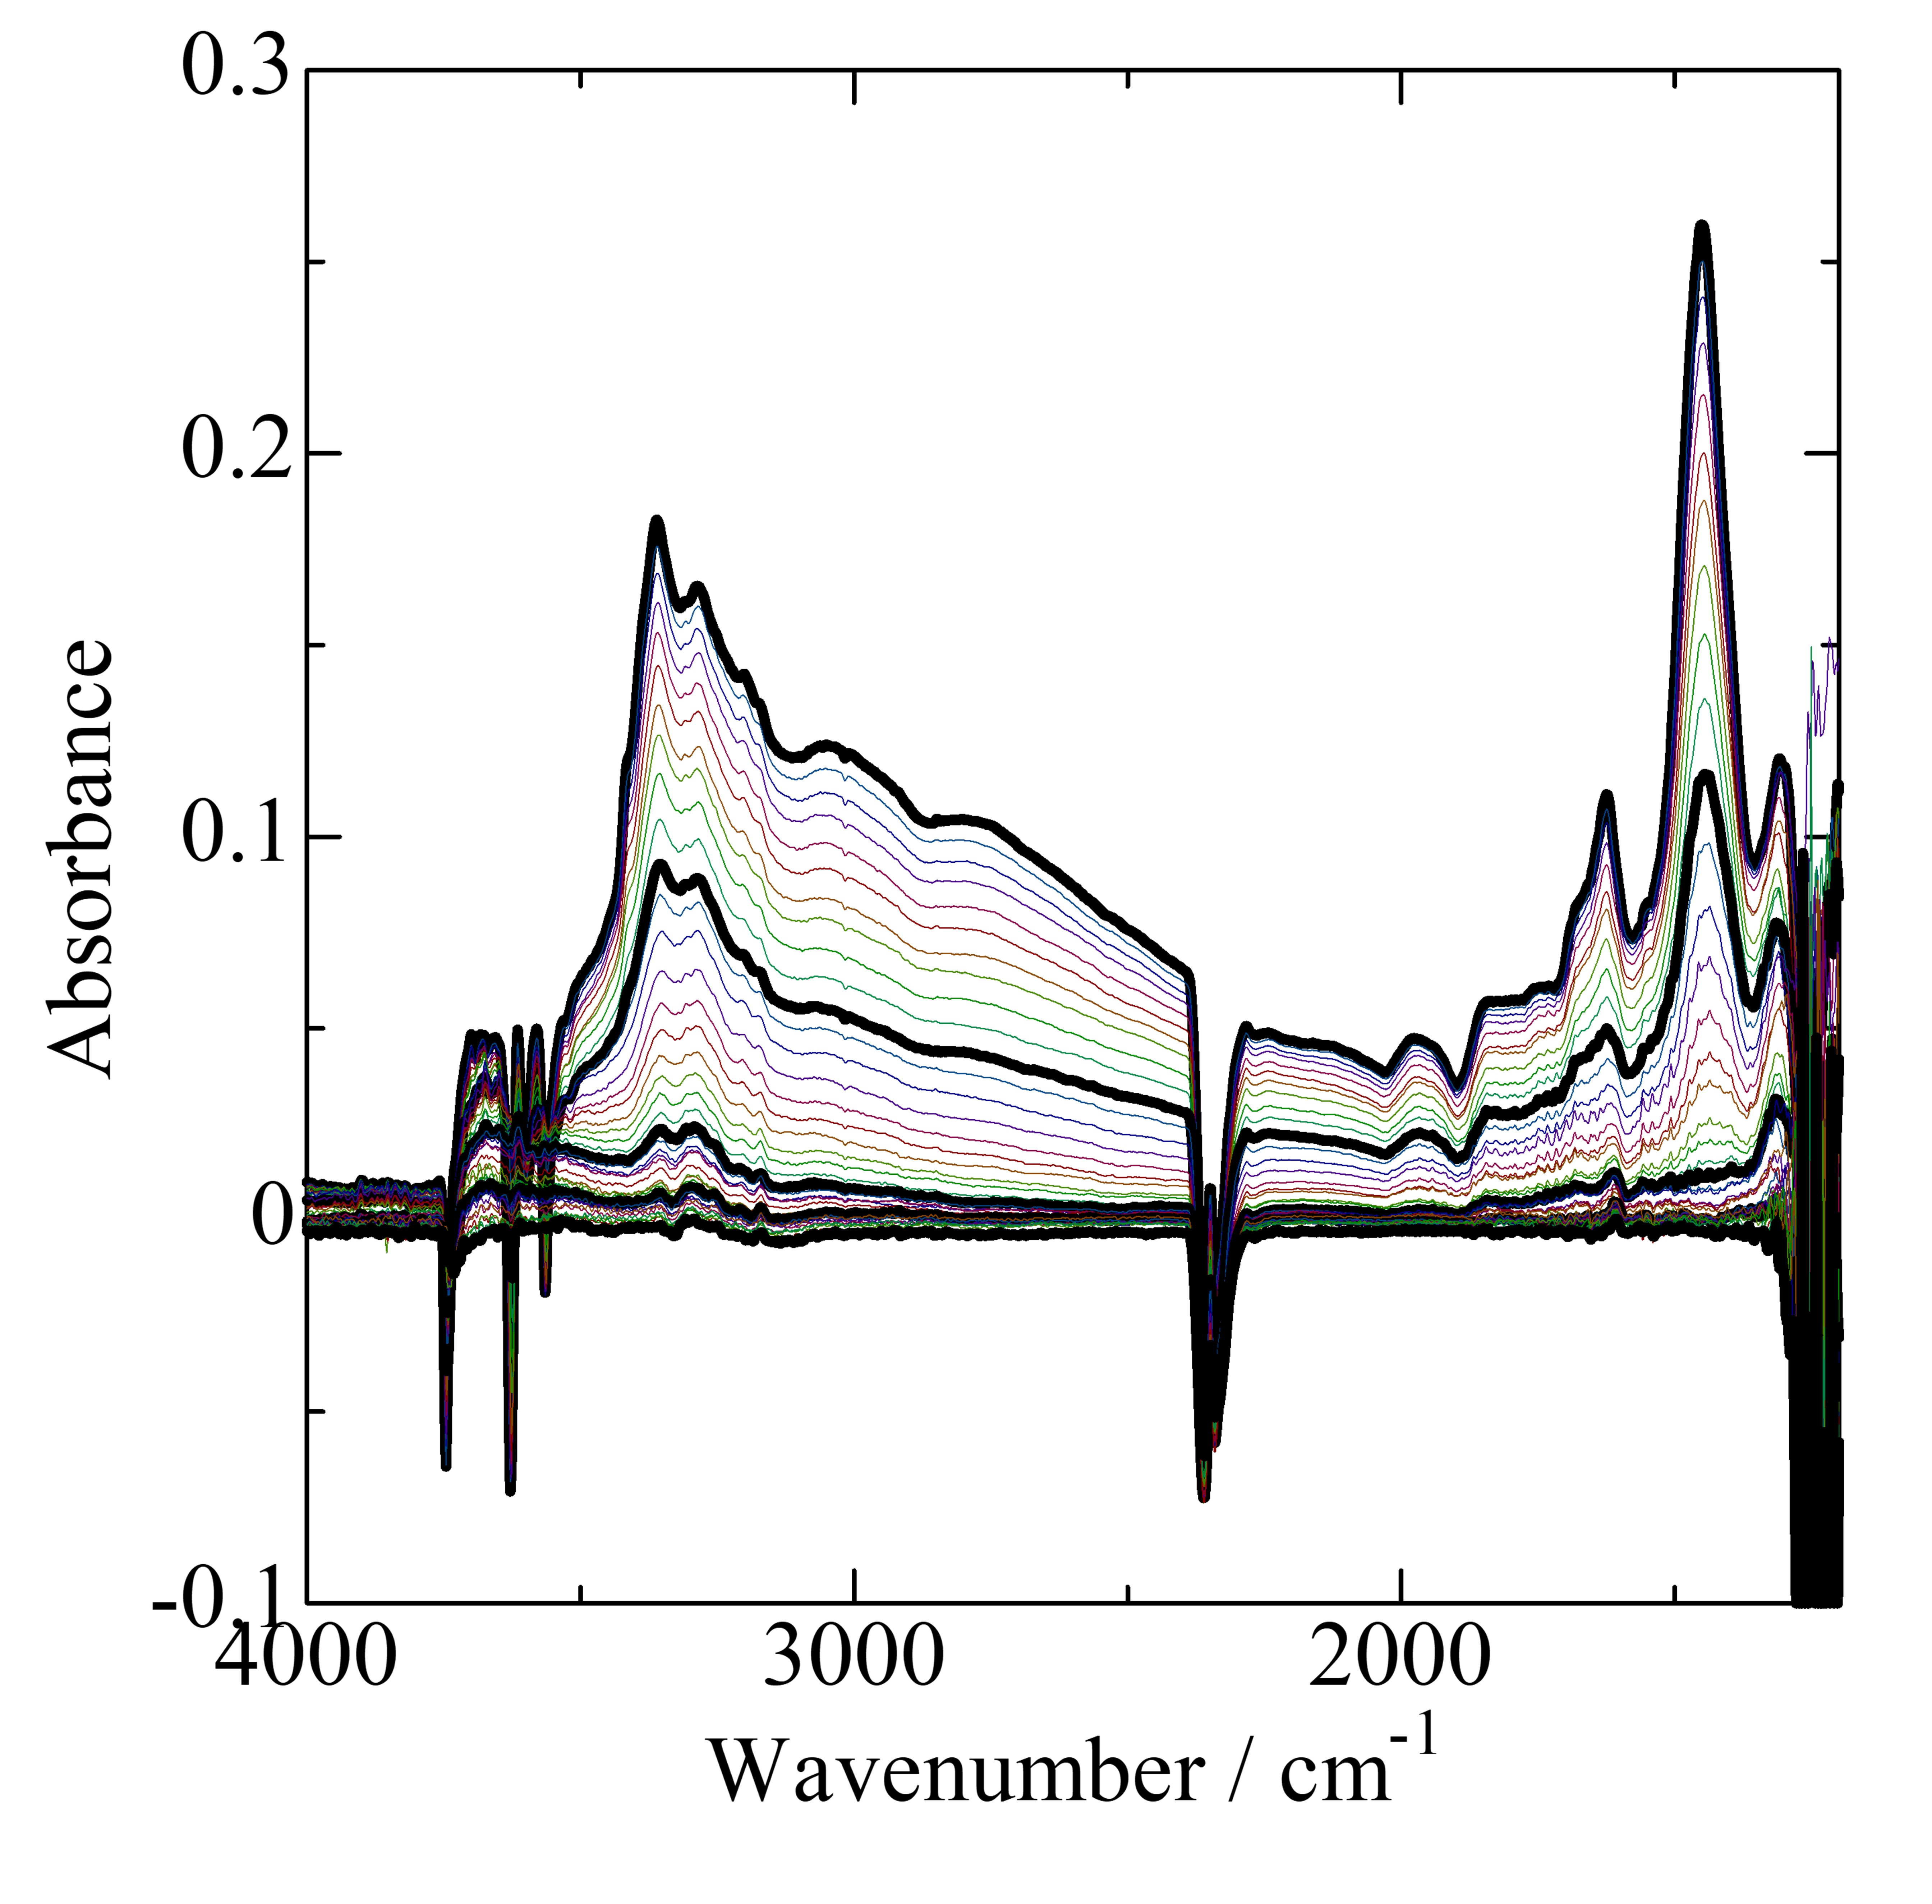
Click to get a high resolution picture
Click to get a data table a 10 K interval (2.5 MB)
Click to get a data table all (10.9 MB)
IRZ-MFI001
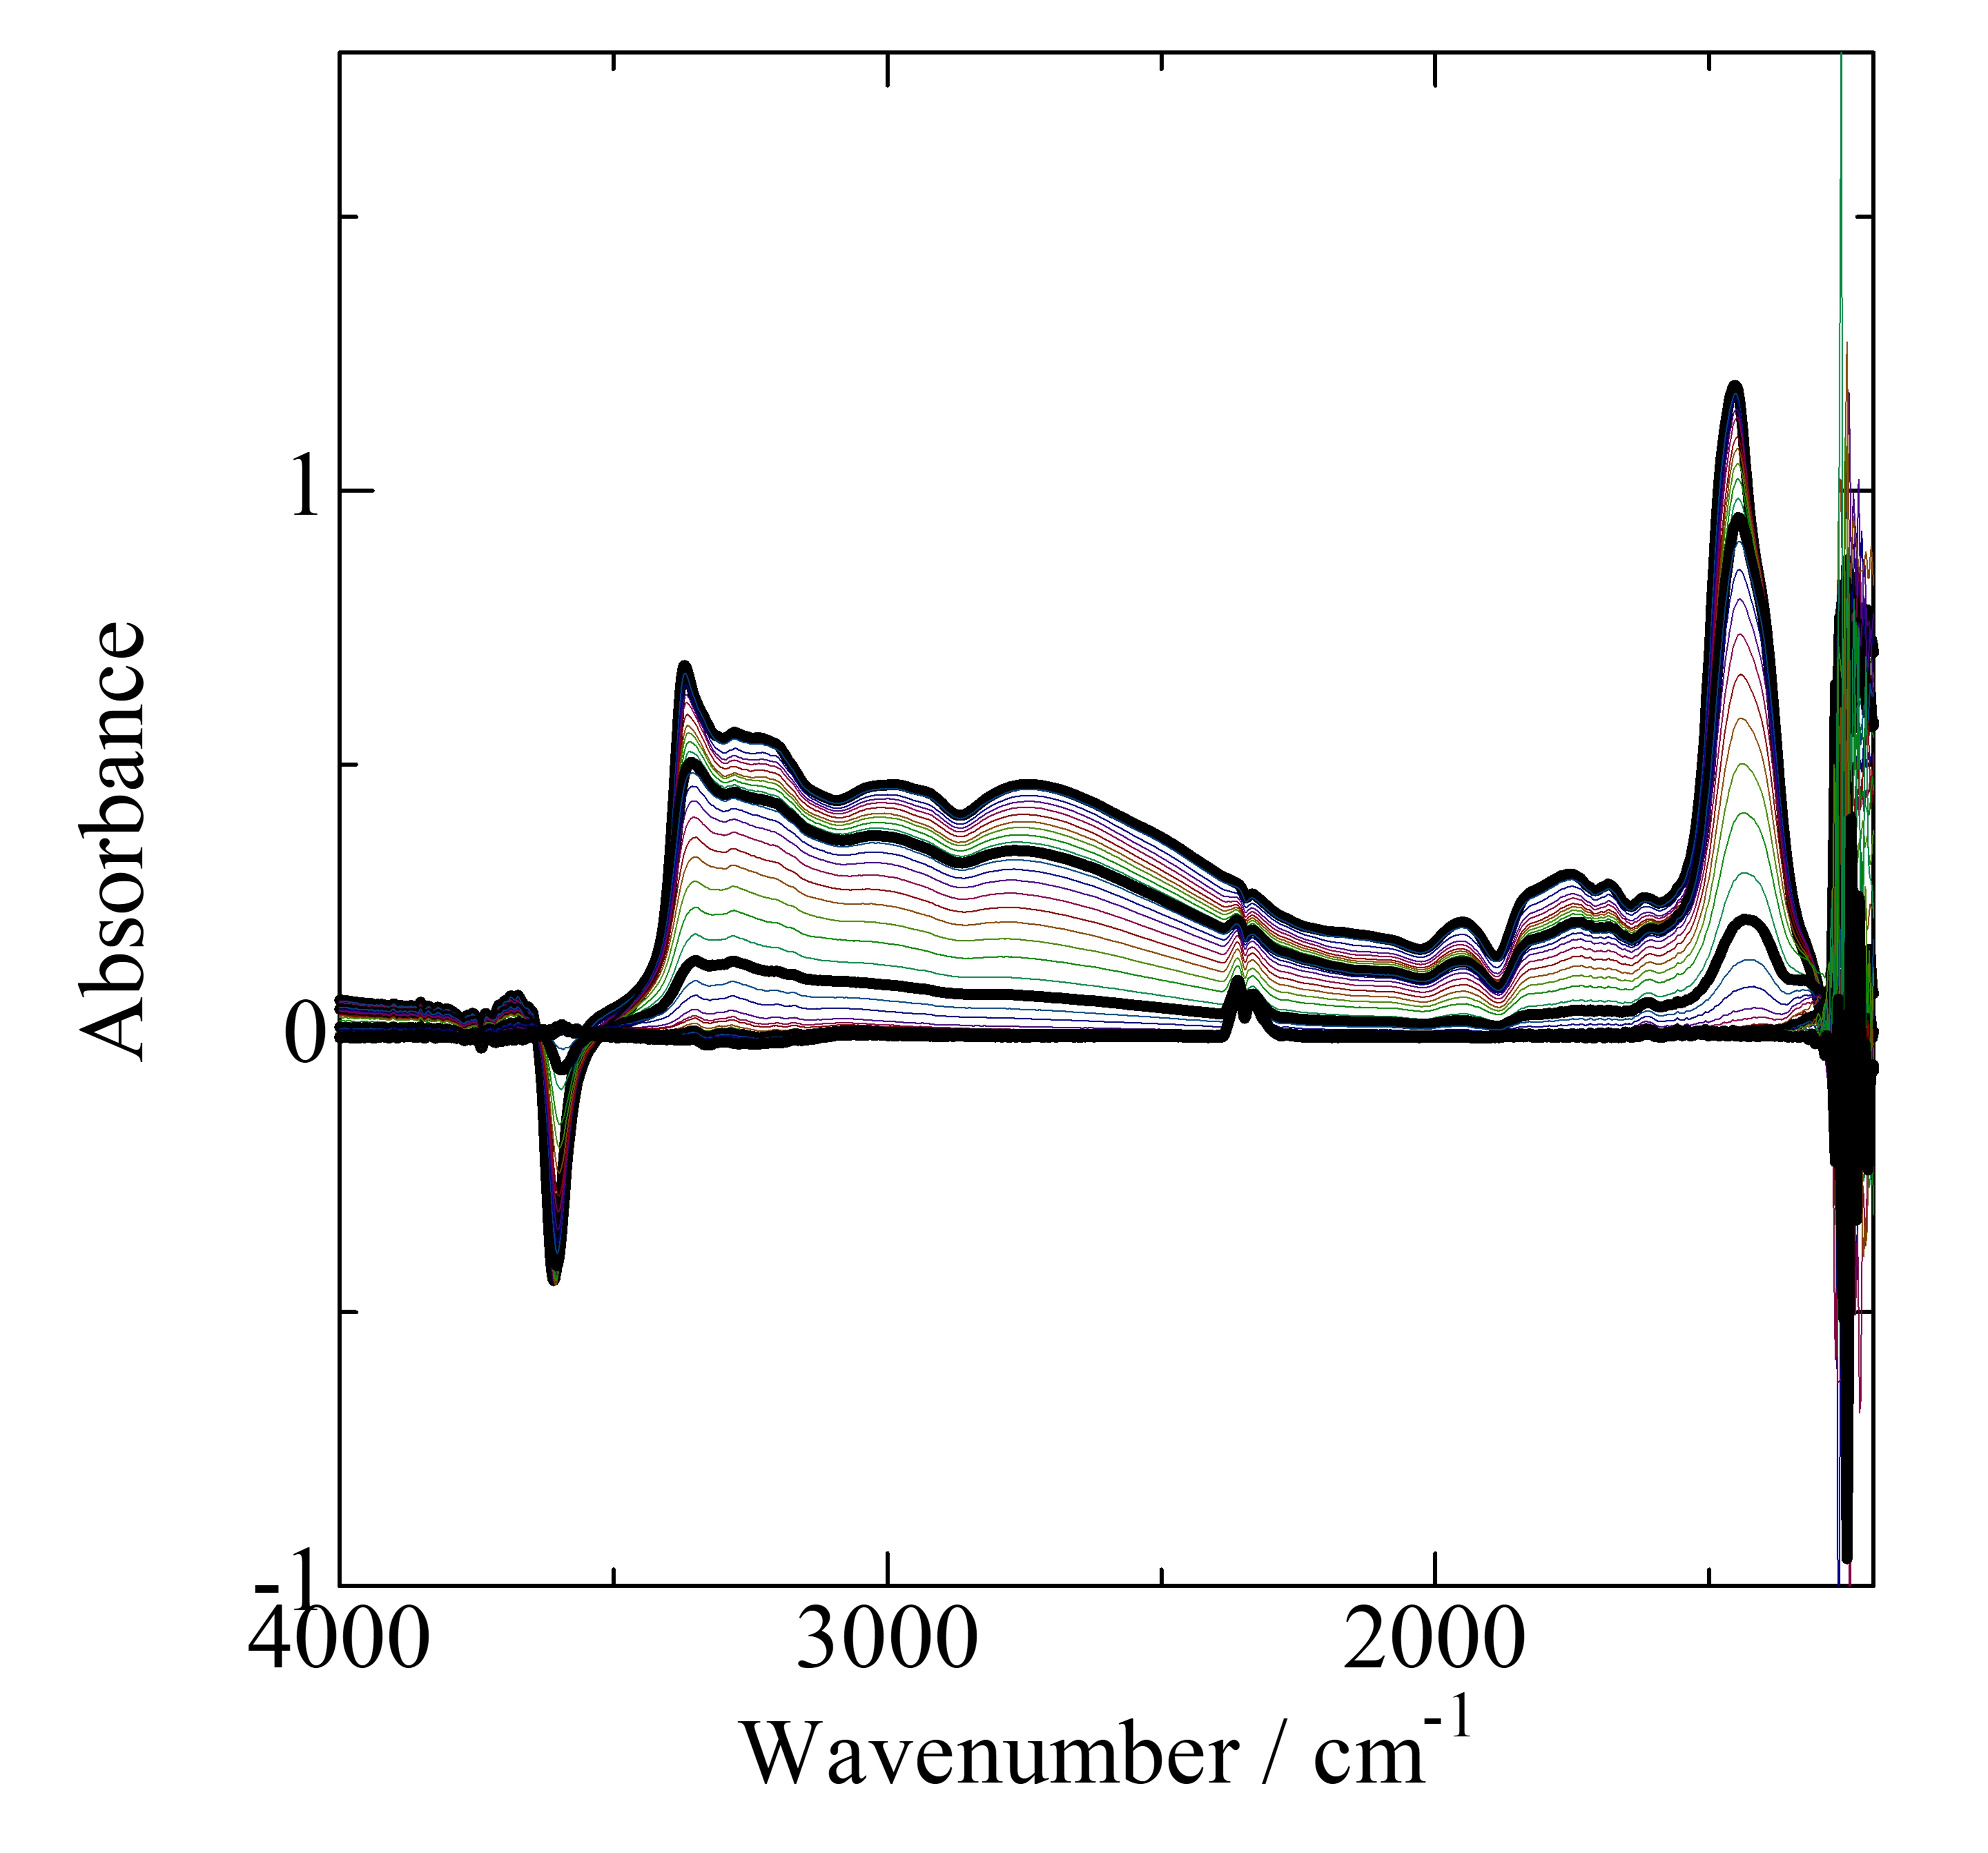
Click to get a high resolution picture
Click to get a data table a 10 K interval (2.4 MB)
Click to get a data table all (10.6 MB)
IRZ-MFI002
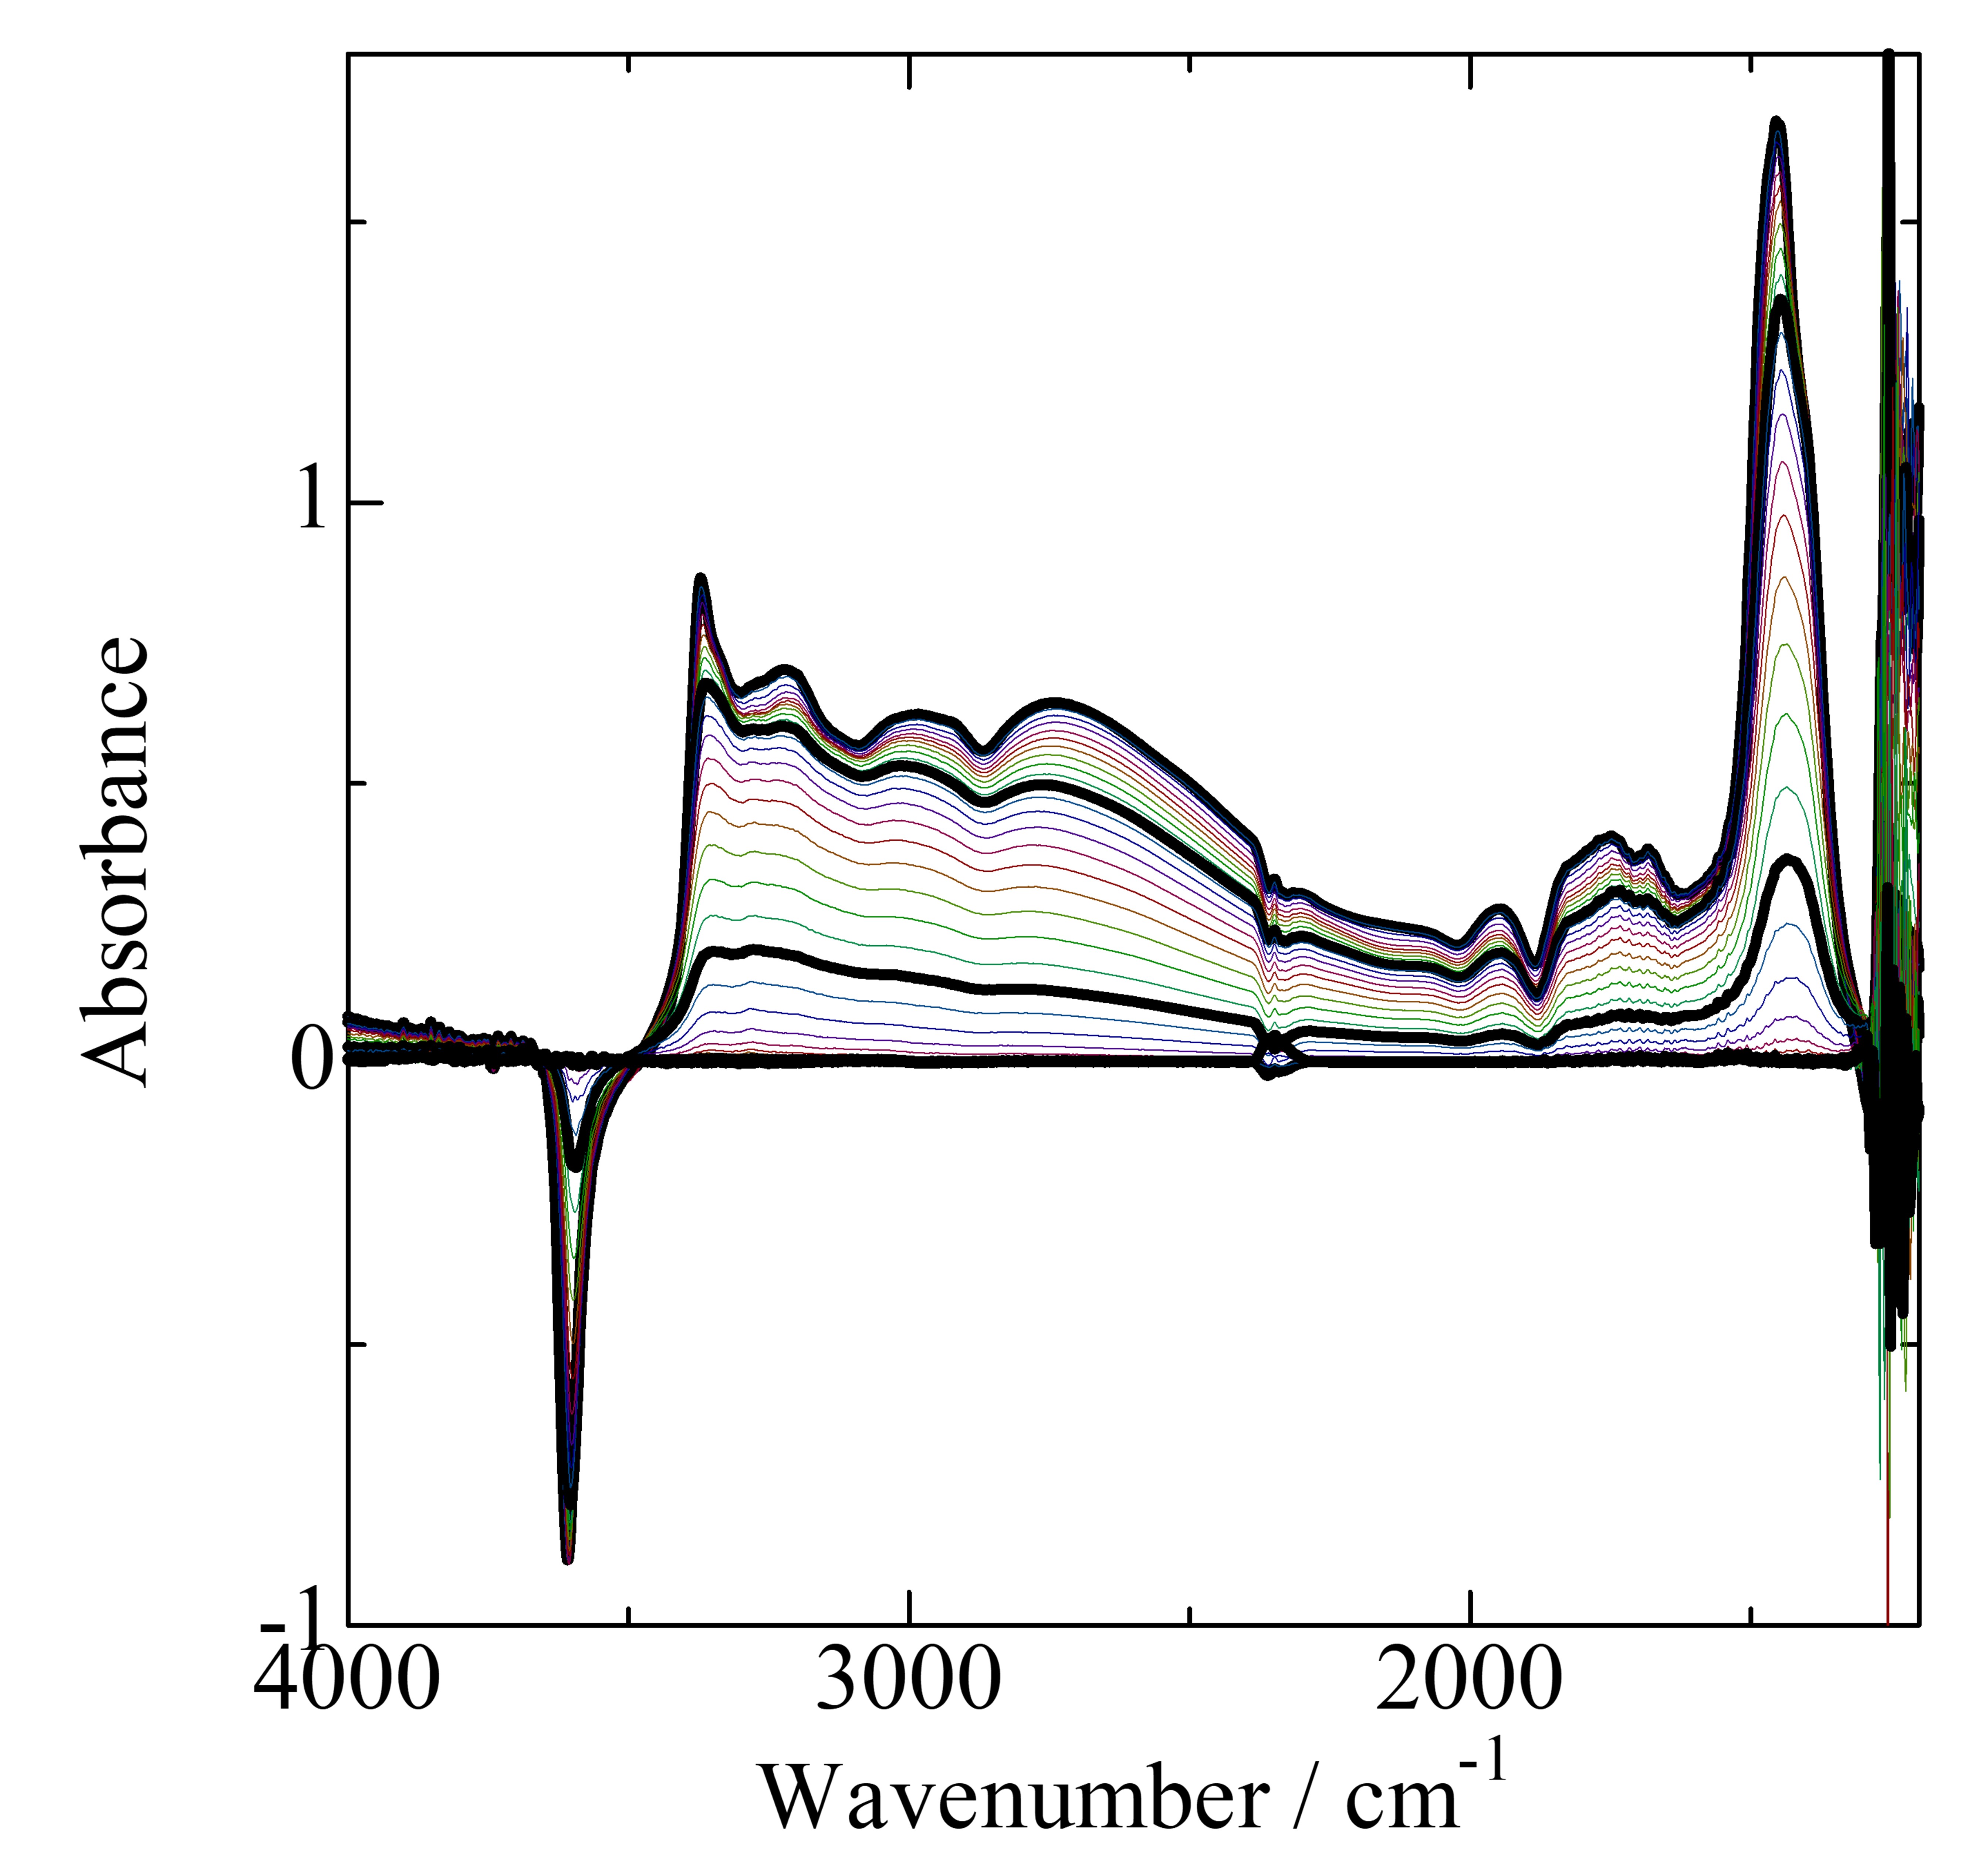
Click to get a high resolution picture
Click to get a data table a 10 K interval (2.4 MB)
Click to get a data table all (10.6 MB)
IRZ-MFI003
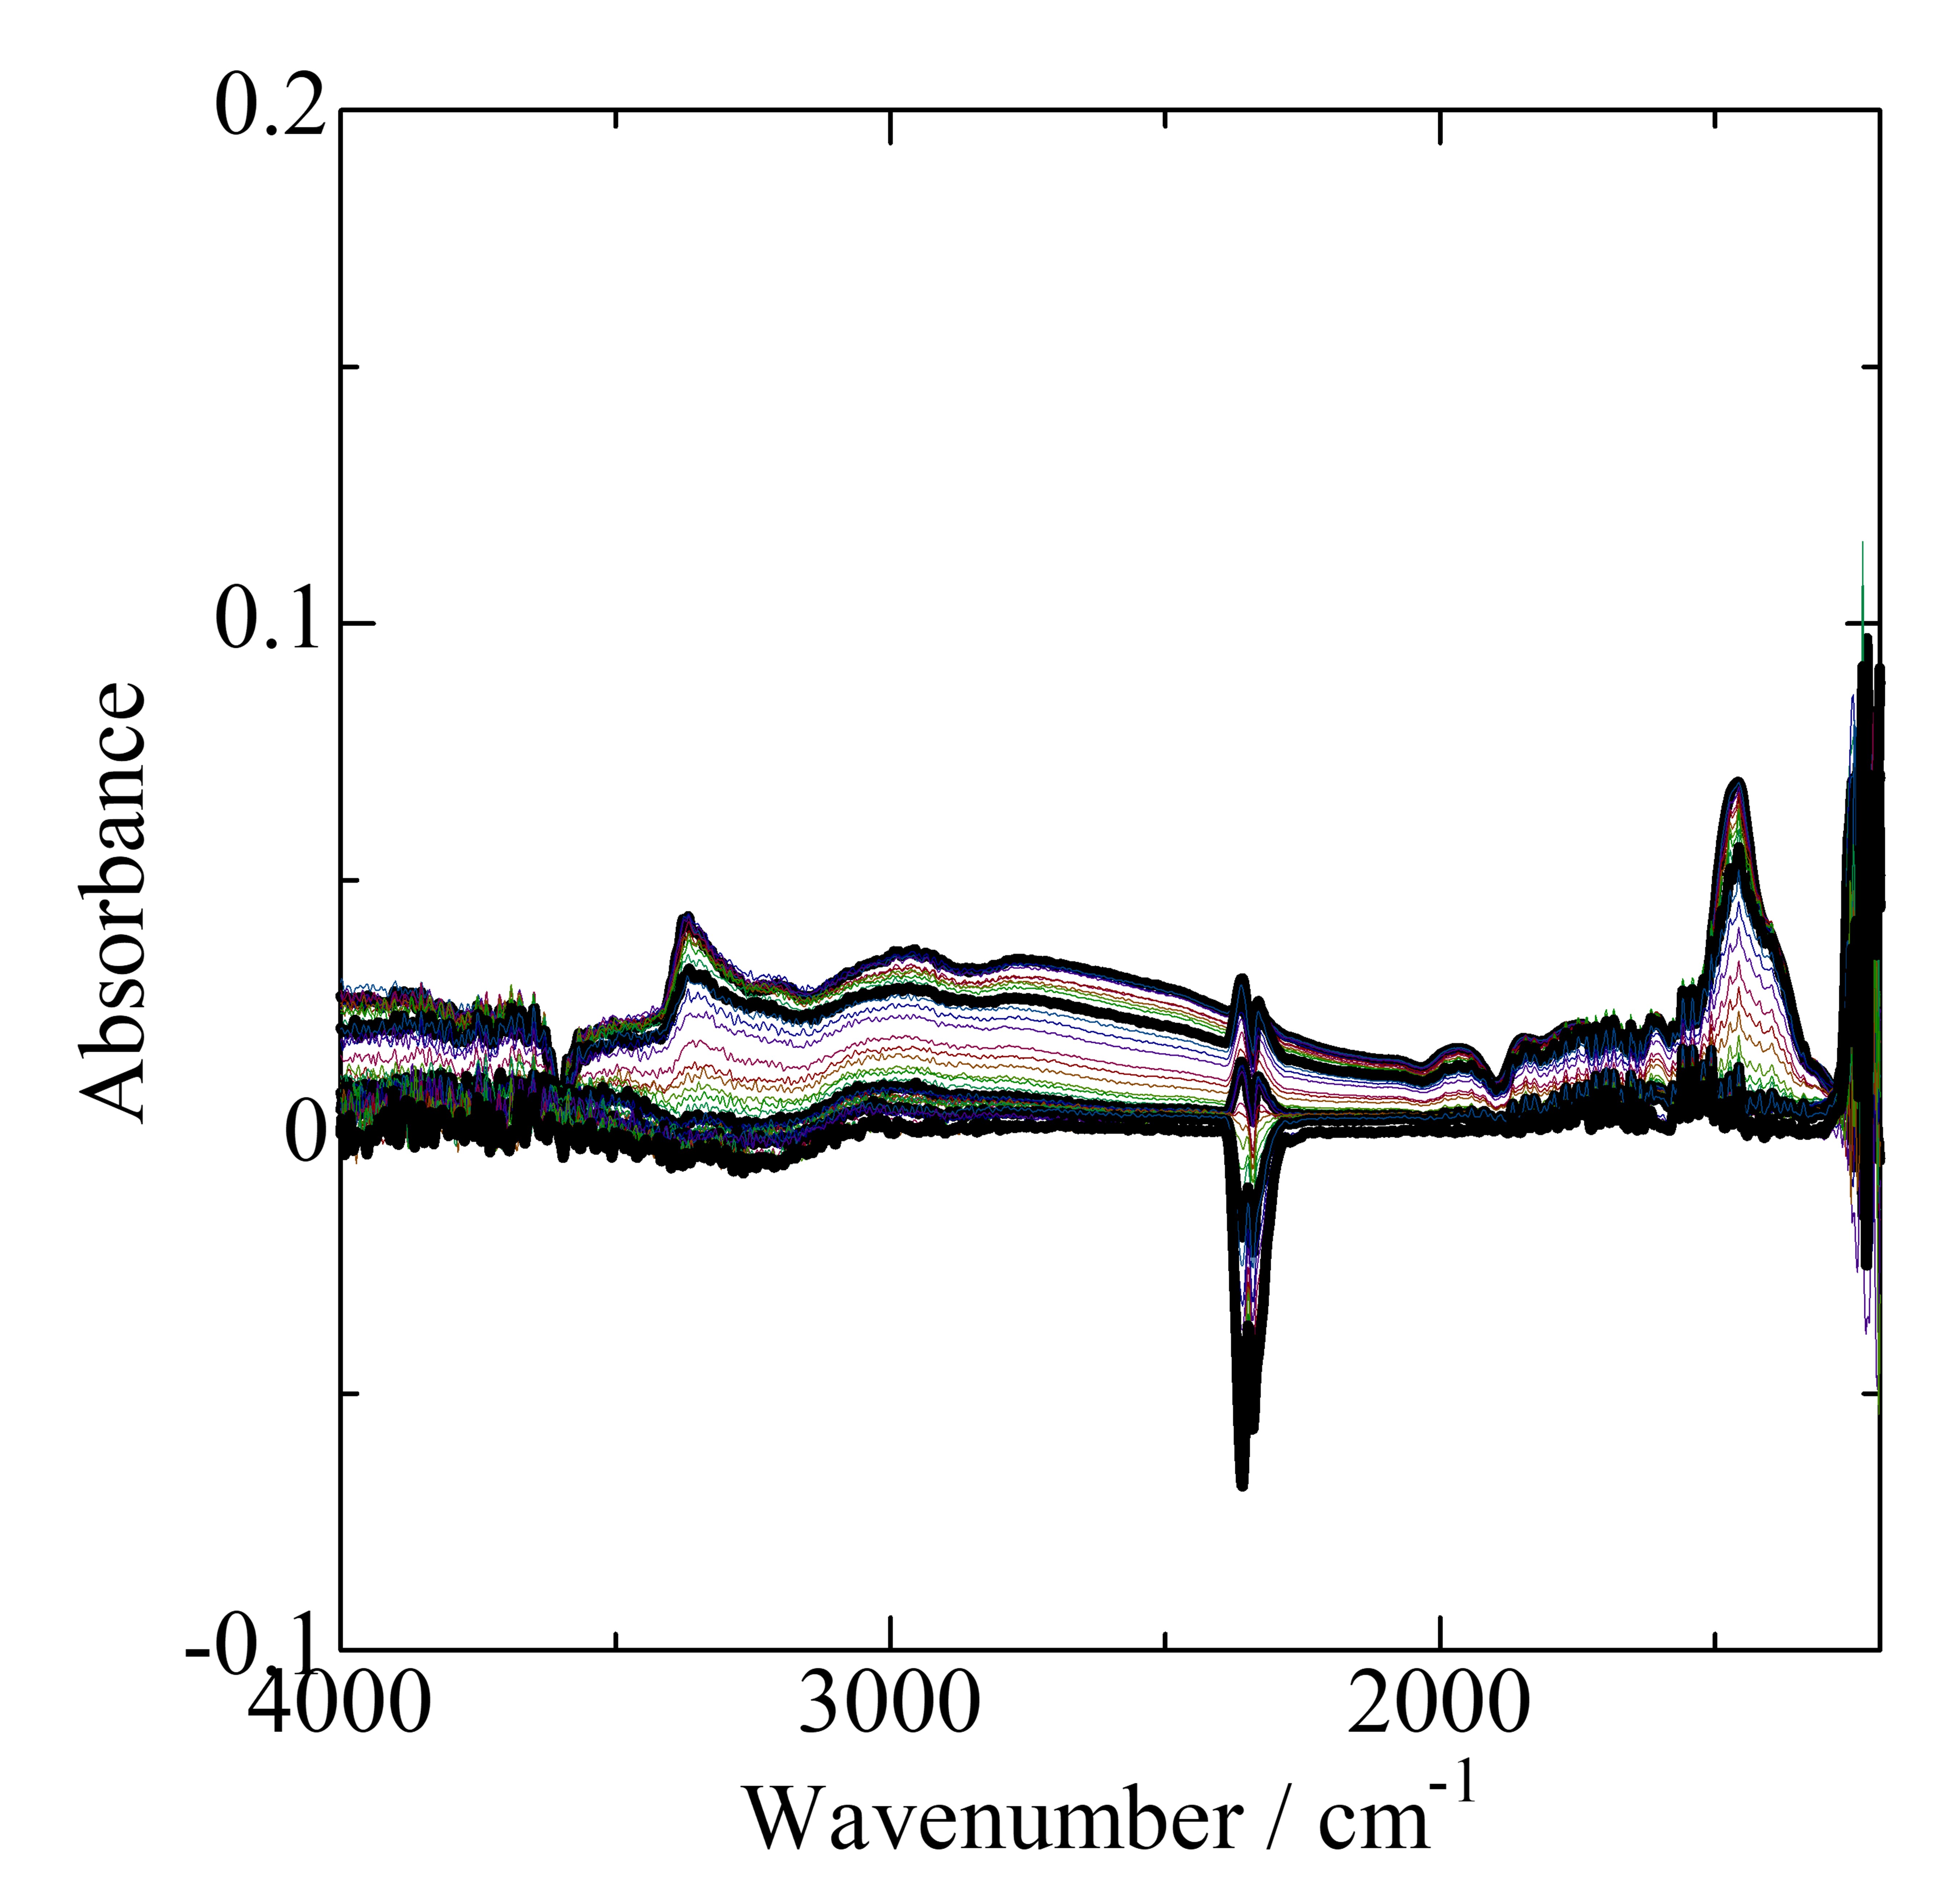
Click to get a high resolution picture
Click to get a data table a 10 K interval (2.4 MB)
Click to get a data table all (10.6 MB)