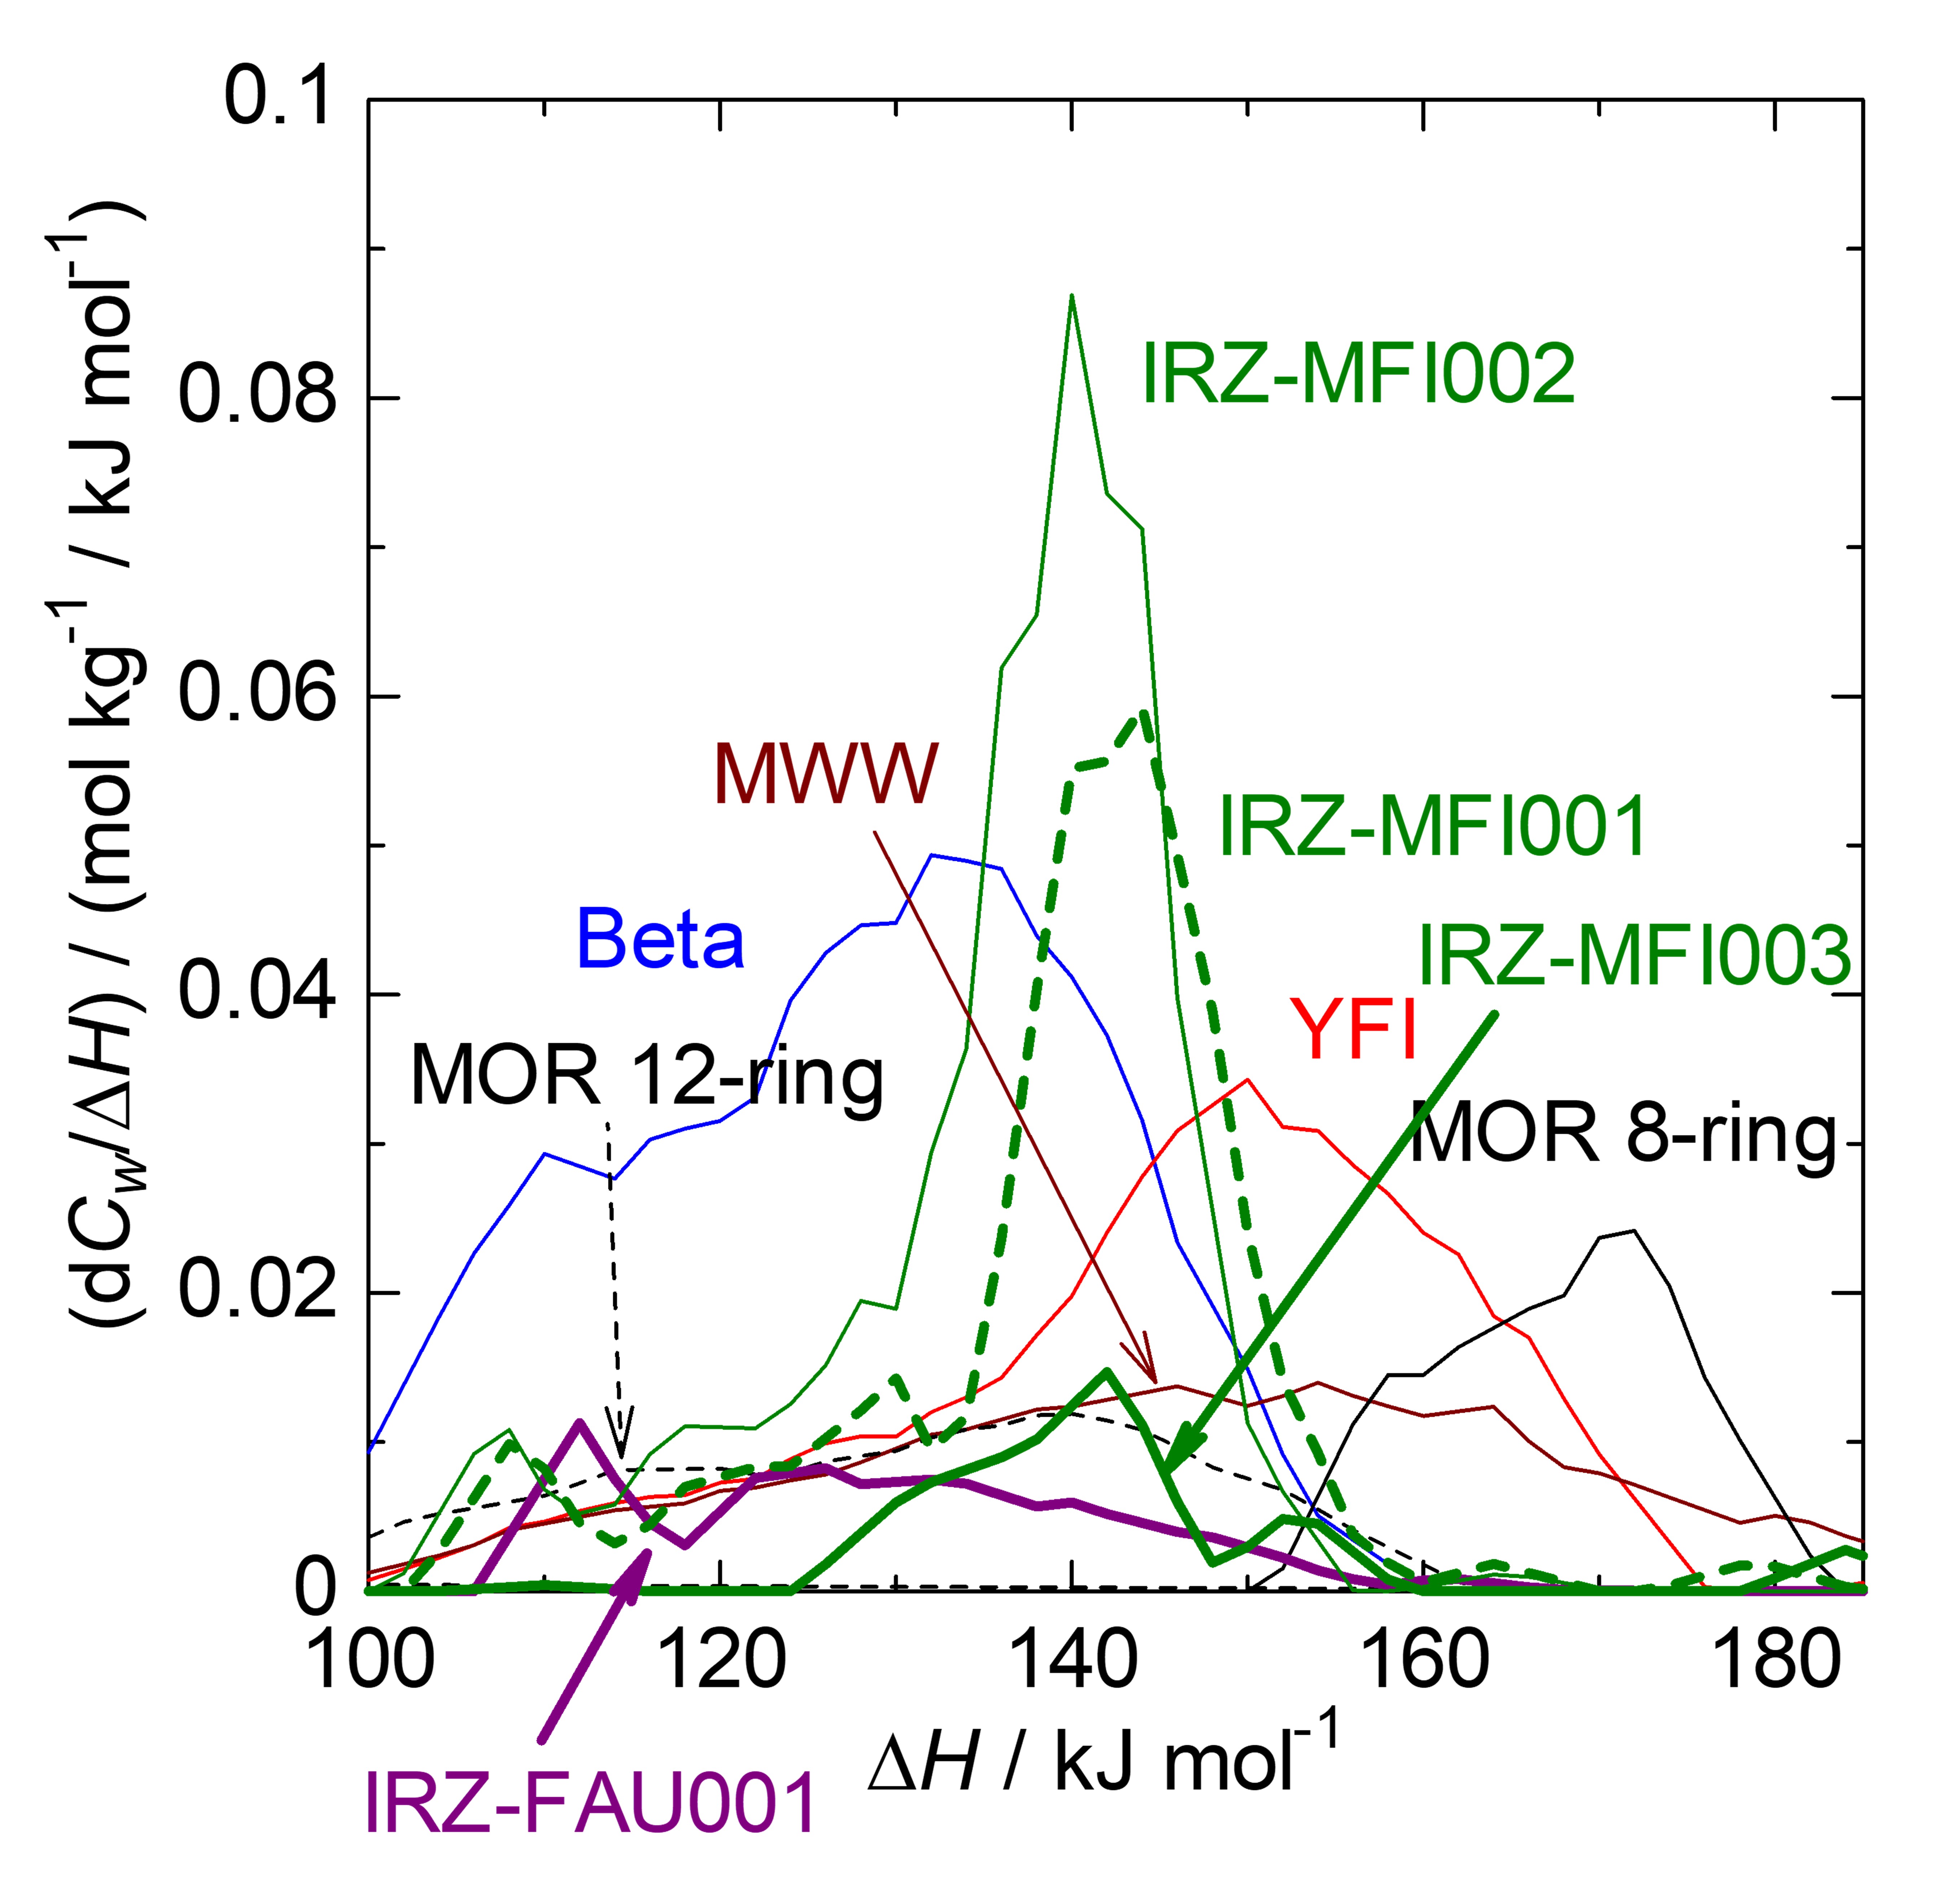
Figure 8
Distributions of ammonia desorption enthalpy of Brønsted acid sites on various zeolites. The data on Beta, MOR, YFI and MWW are taken from a recent paper20. On MOR, the ammonia desorption enthalpies of Brønsted sites in 8- and 12-ring are separately analyzed, because the OH stretching bands are identified in IR spectrum. The plots were modified with smoothing.
Click to get a high resolution picture
Click to get a data table (0.01 MB)