Figure 7
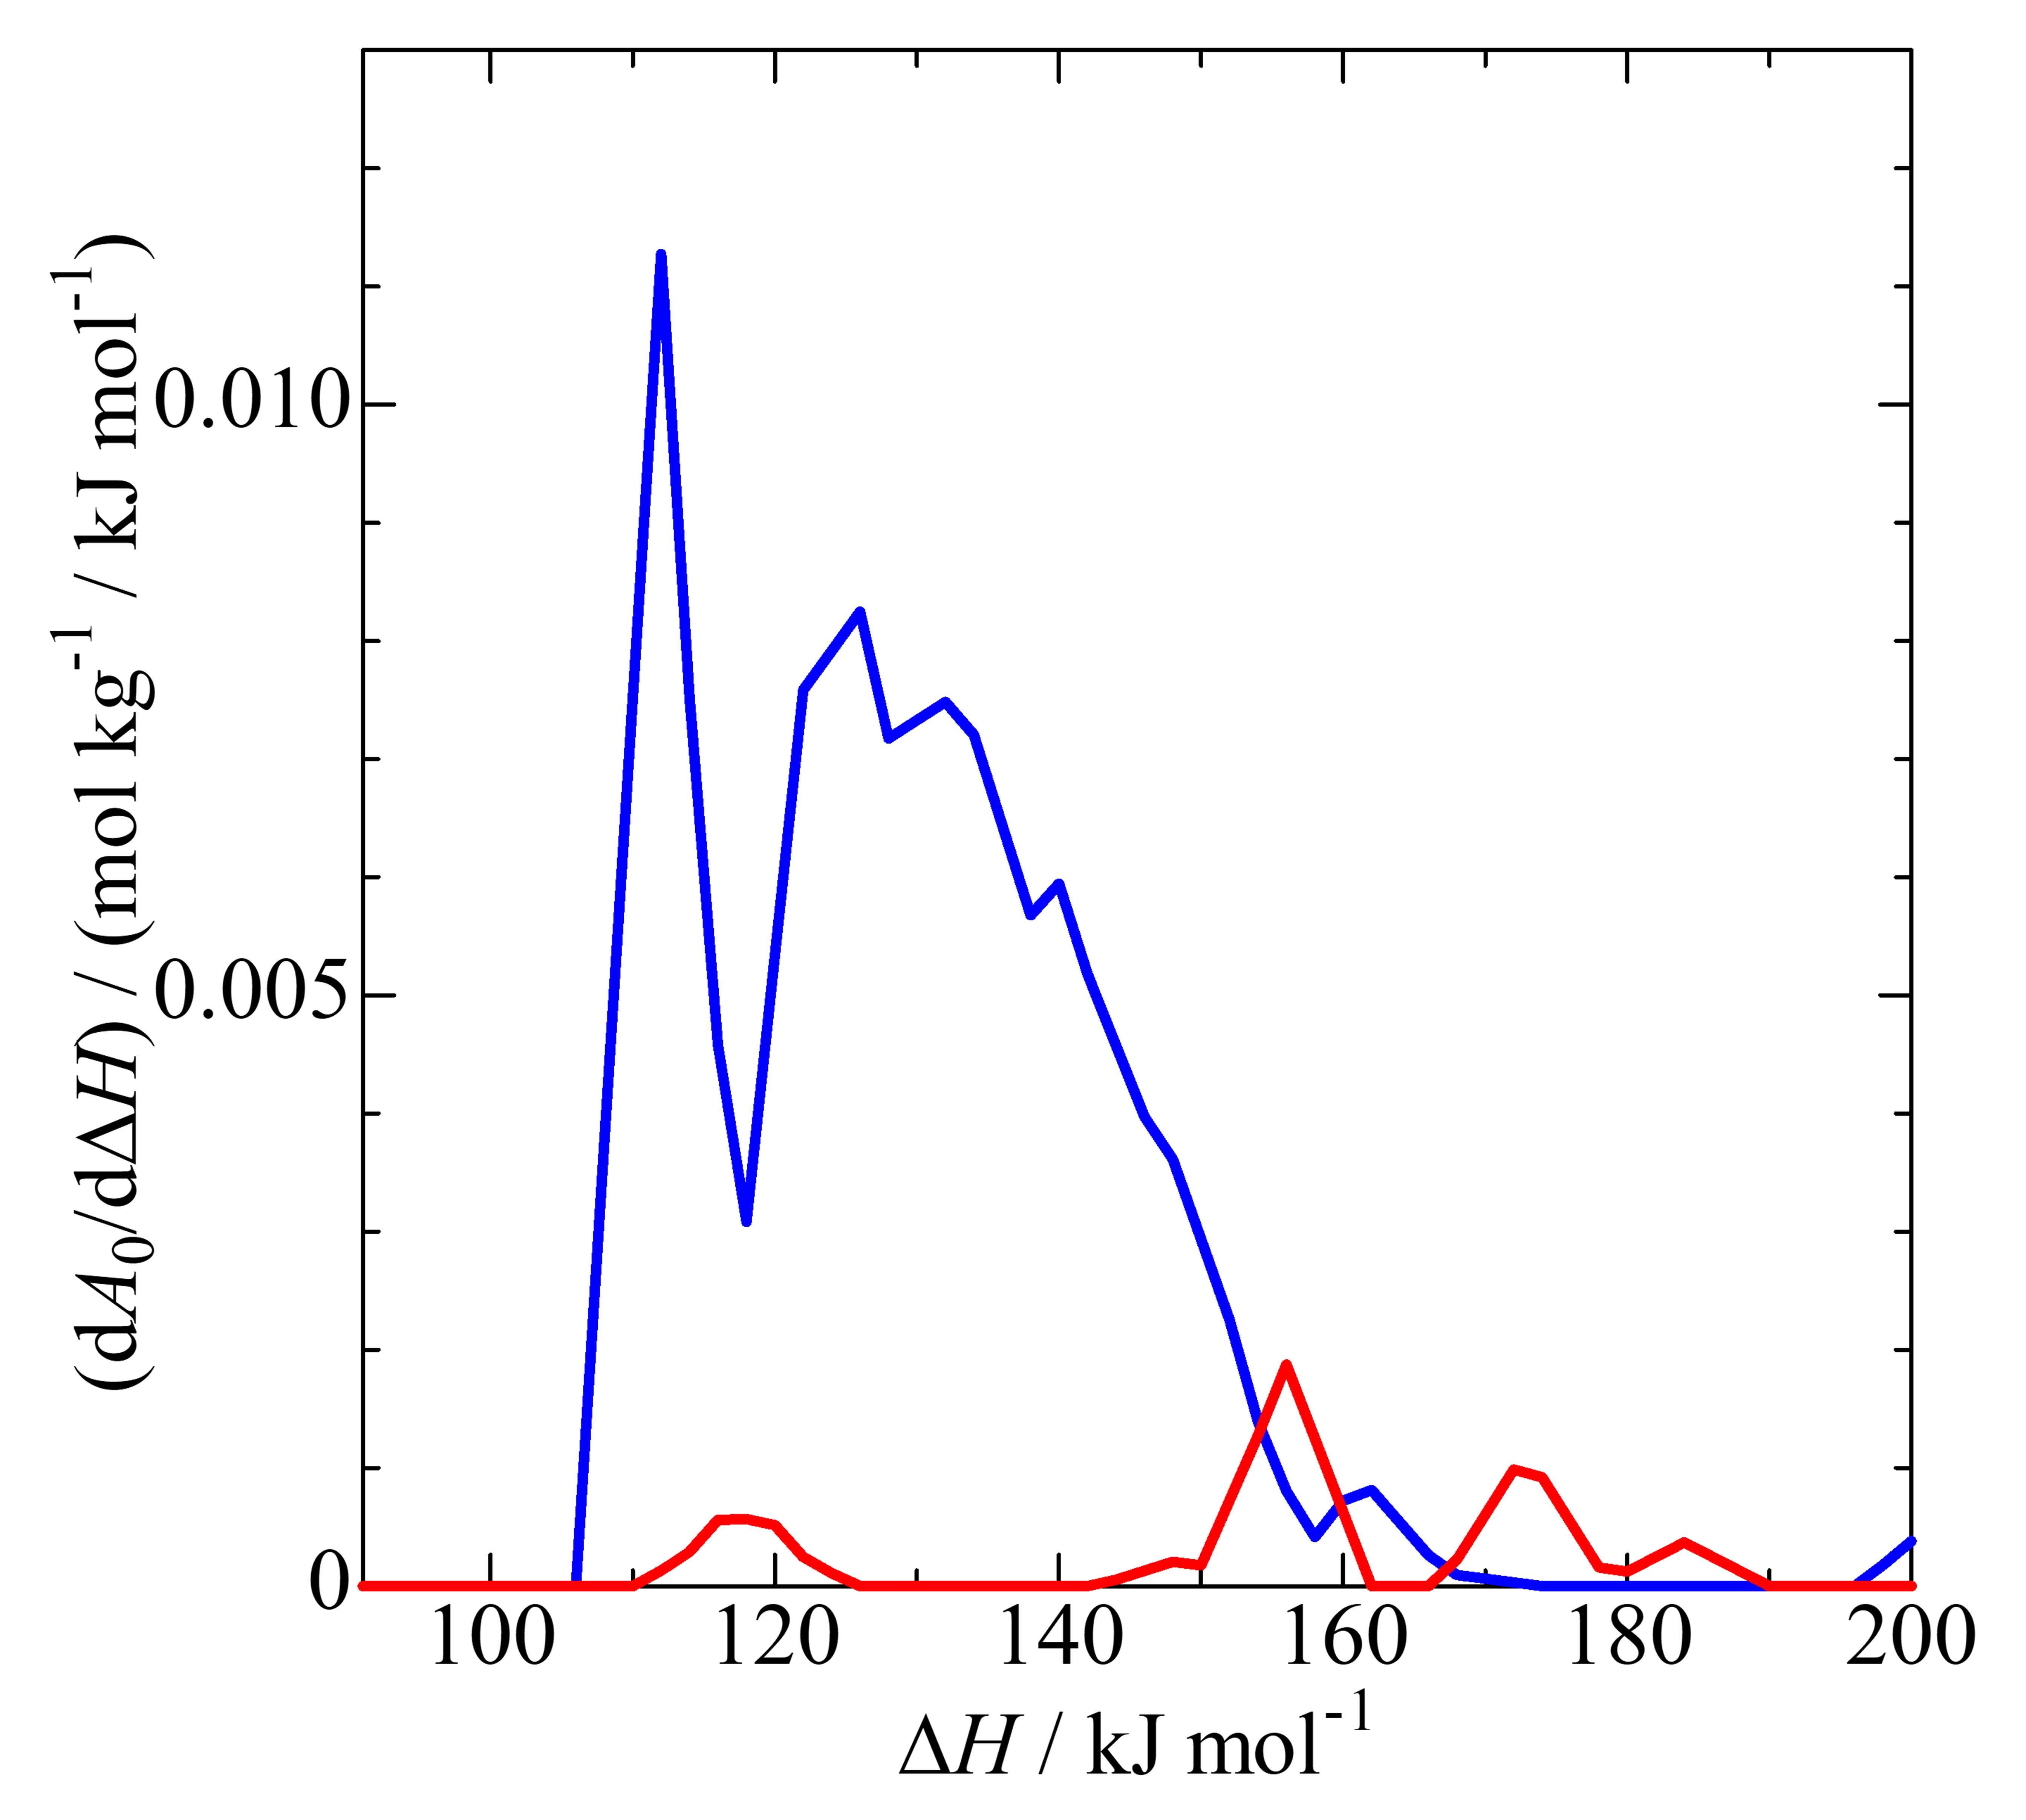
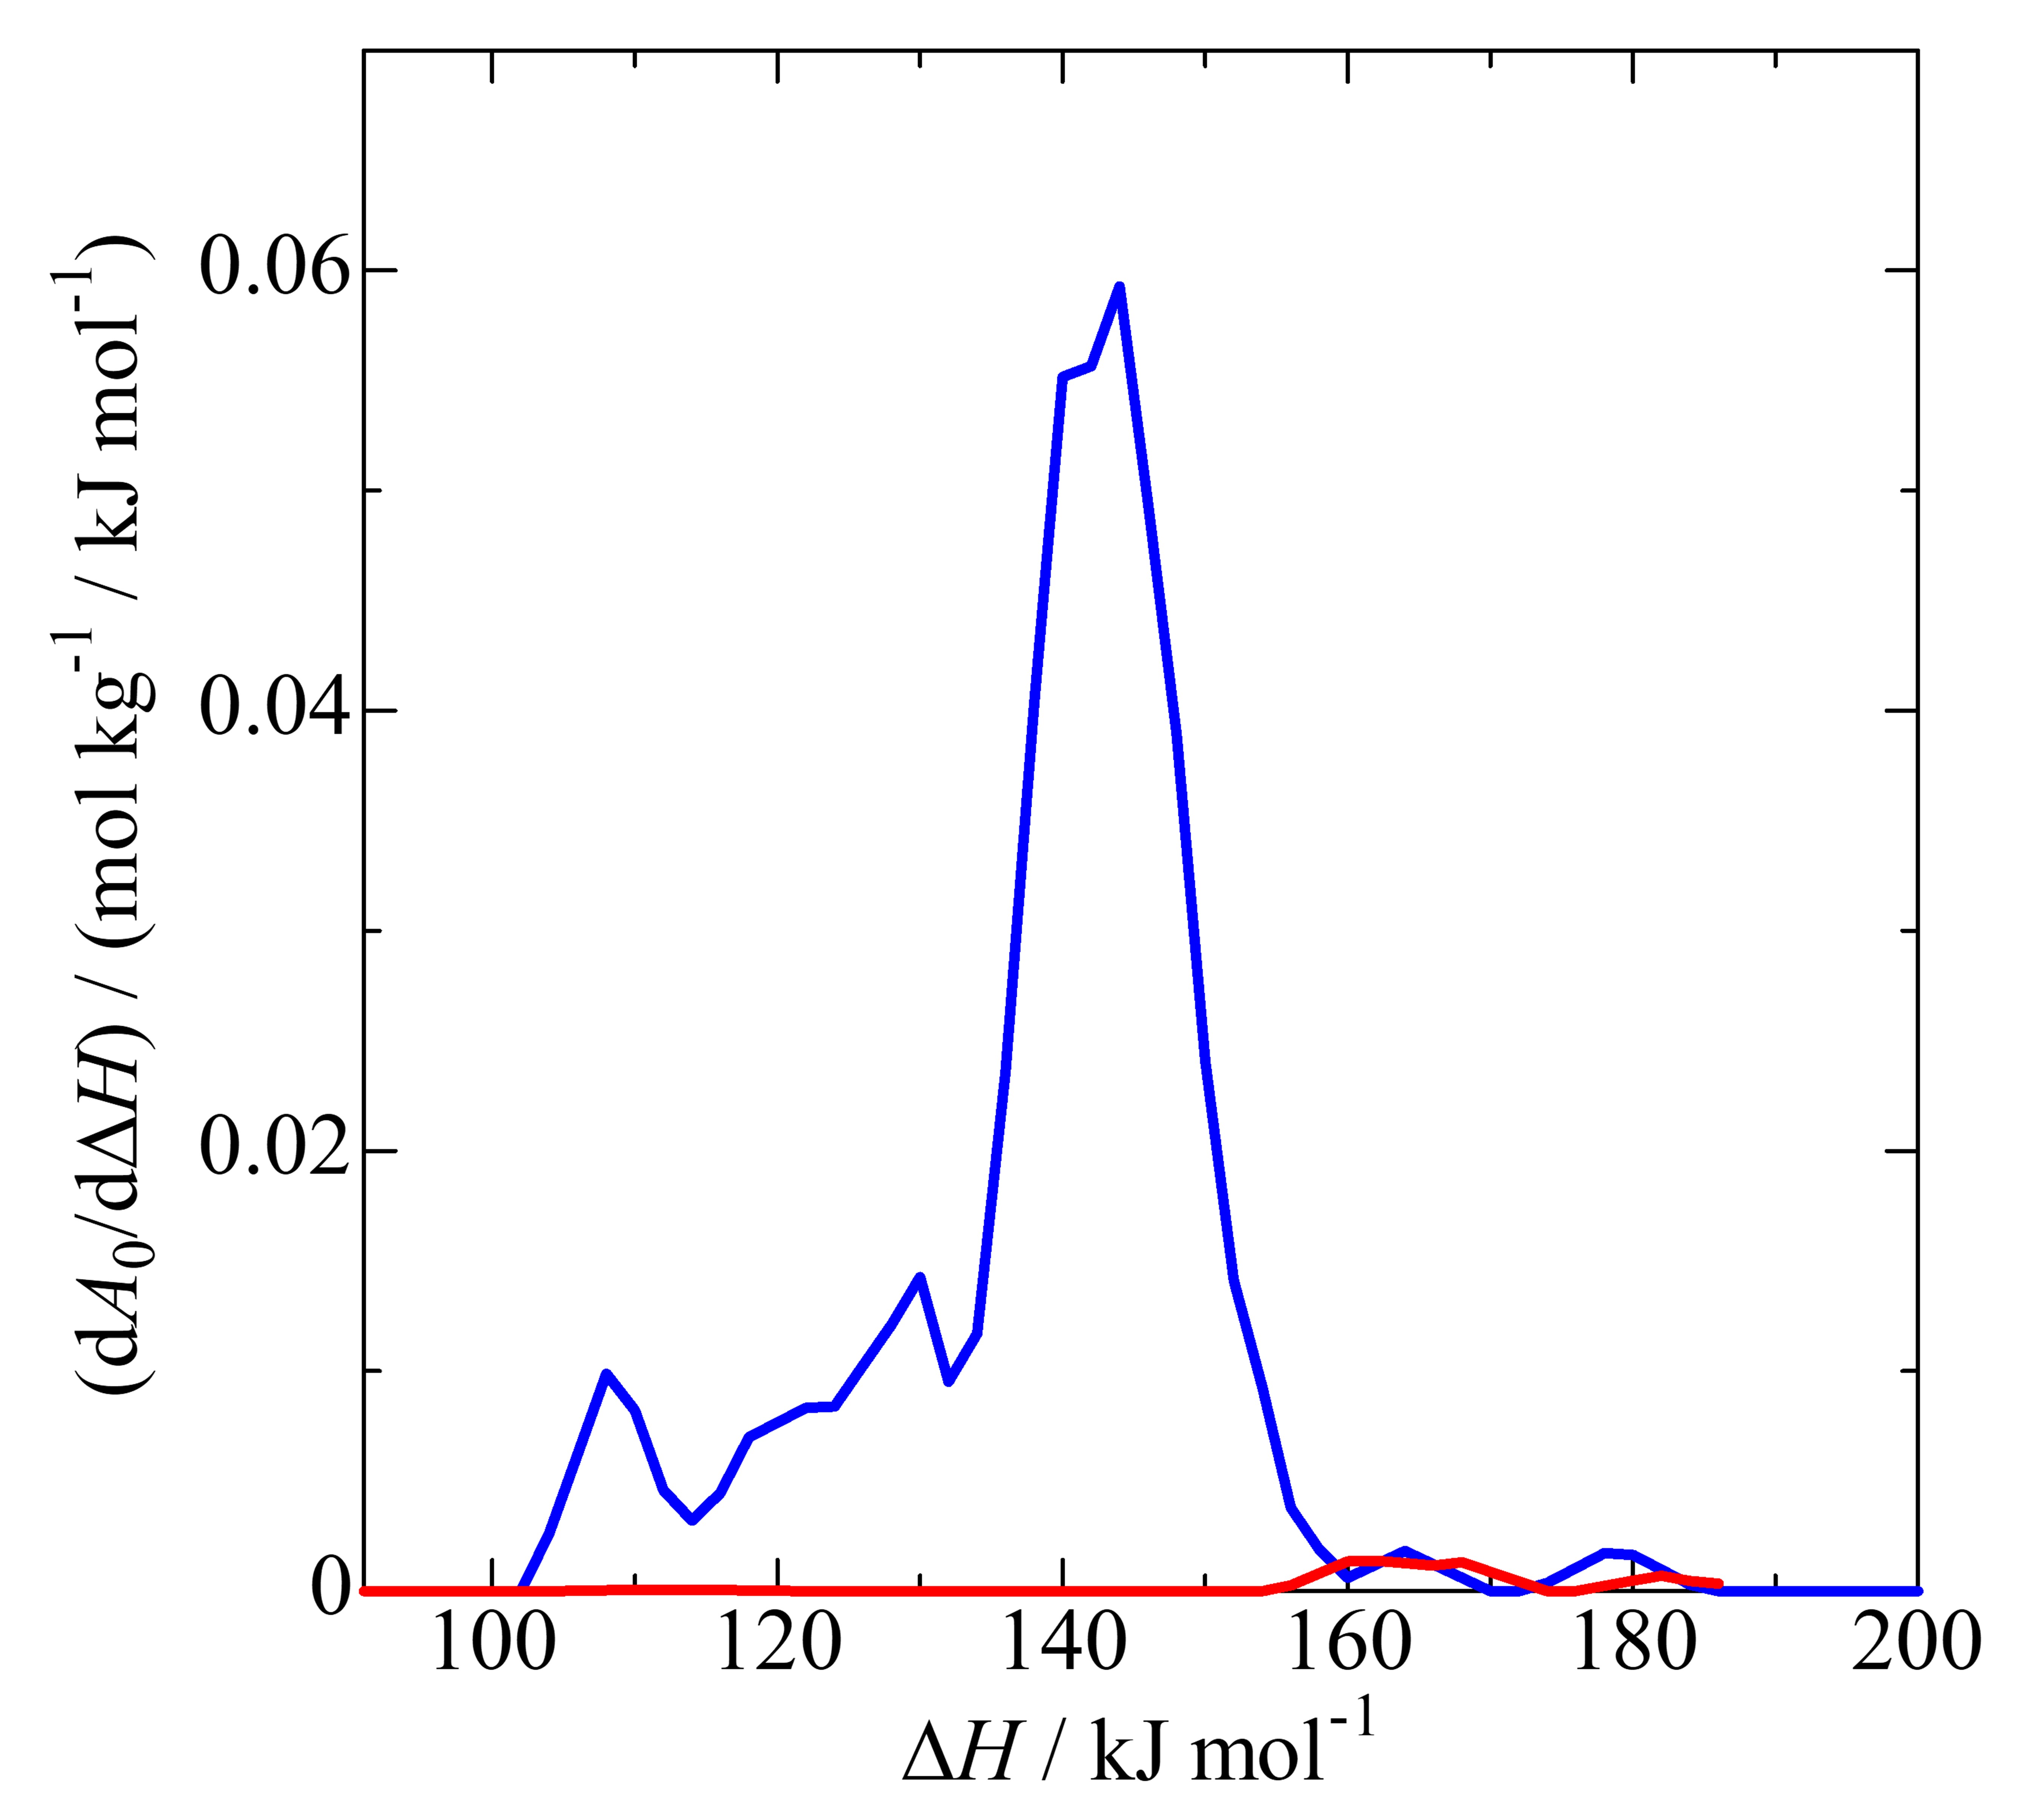
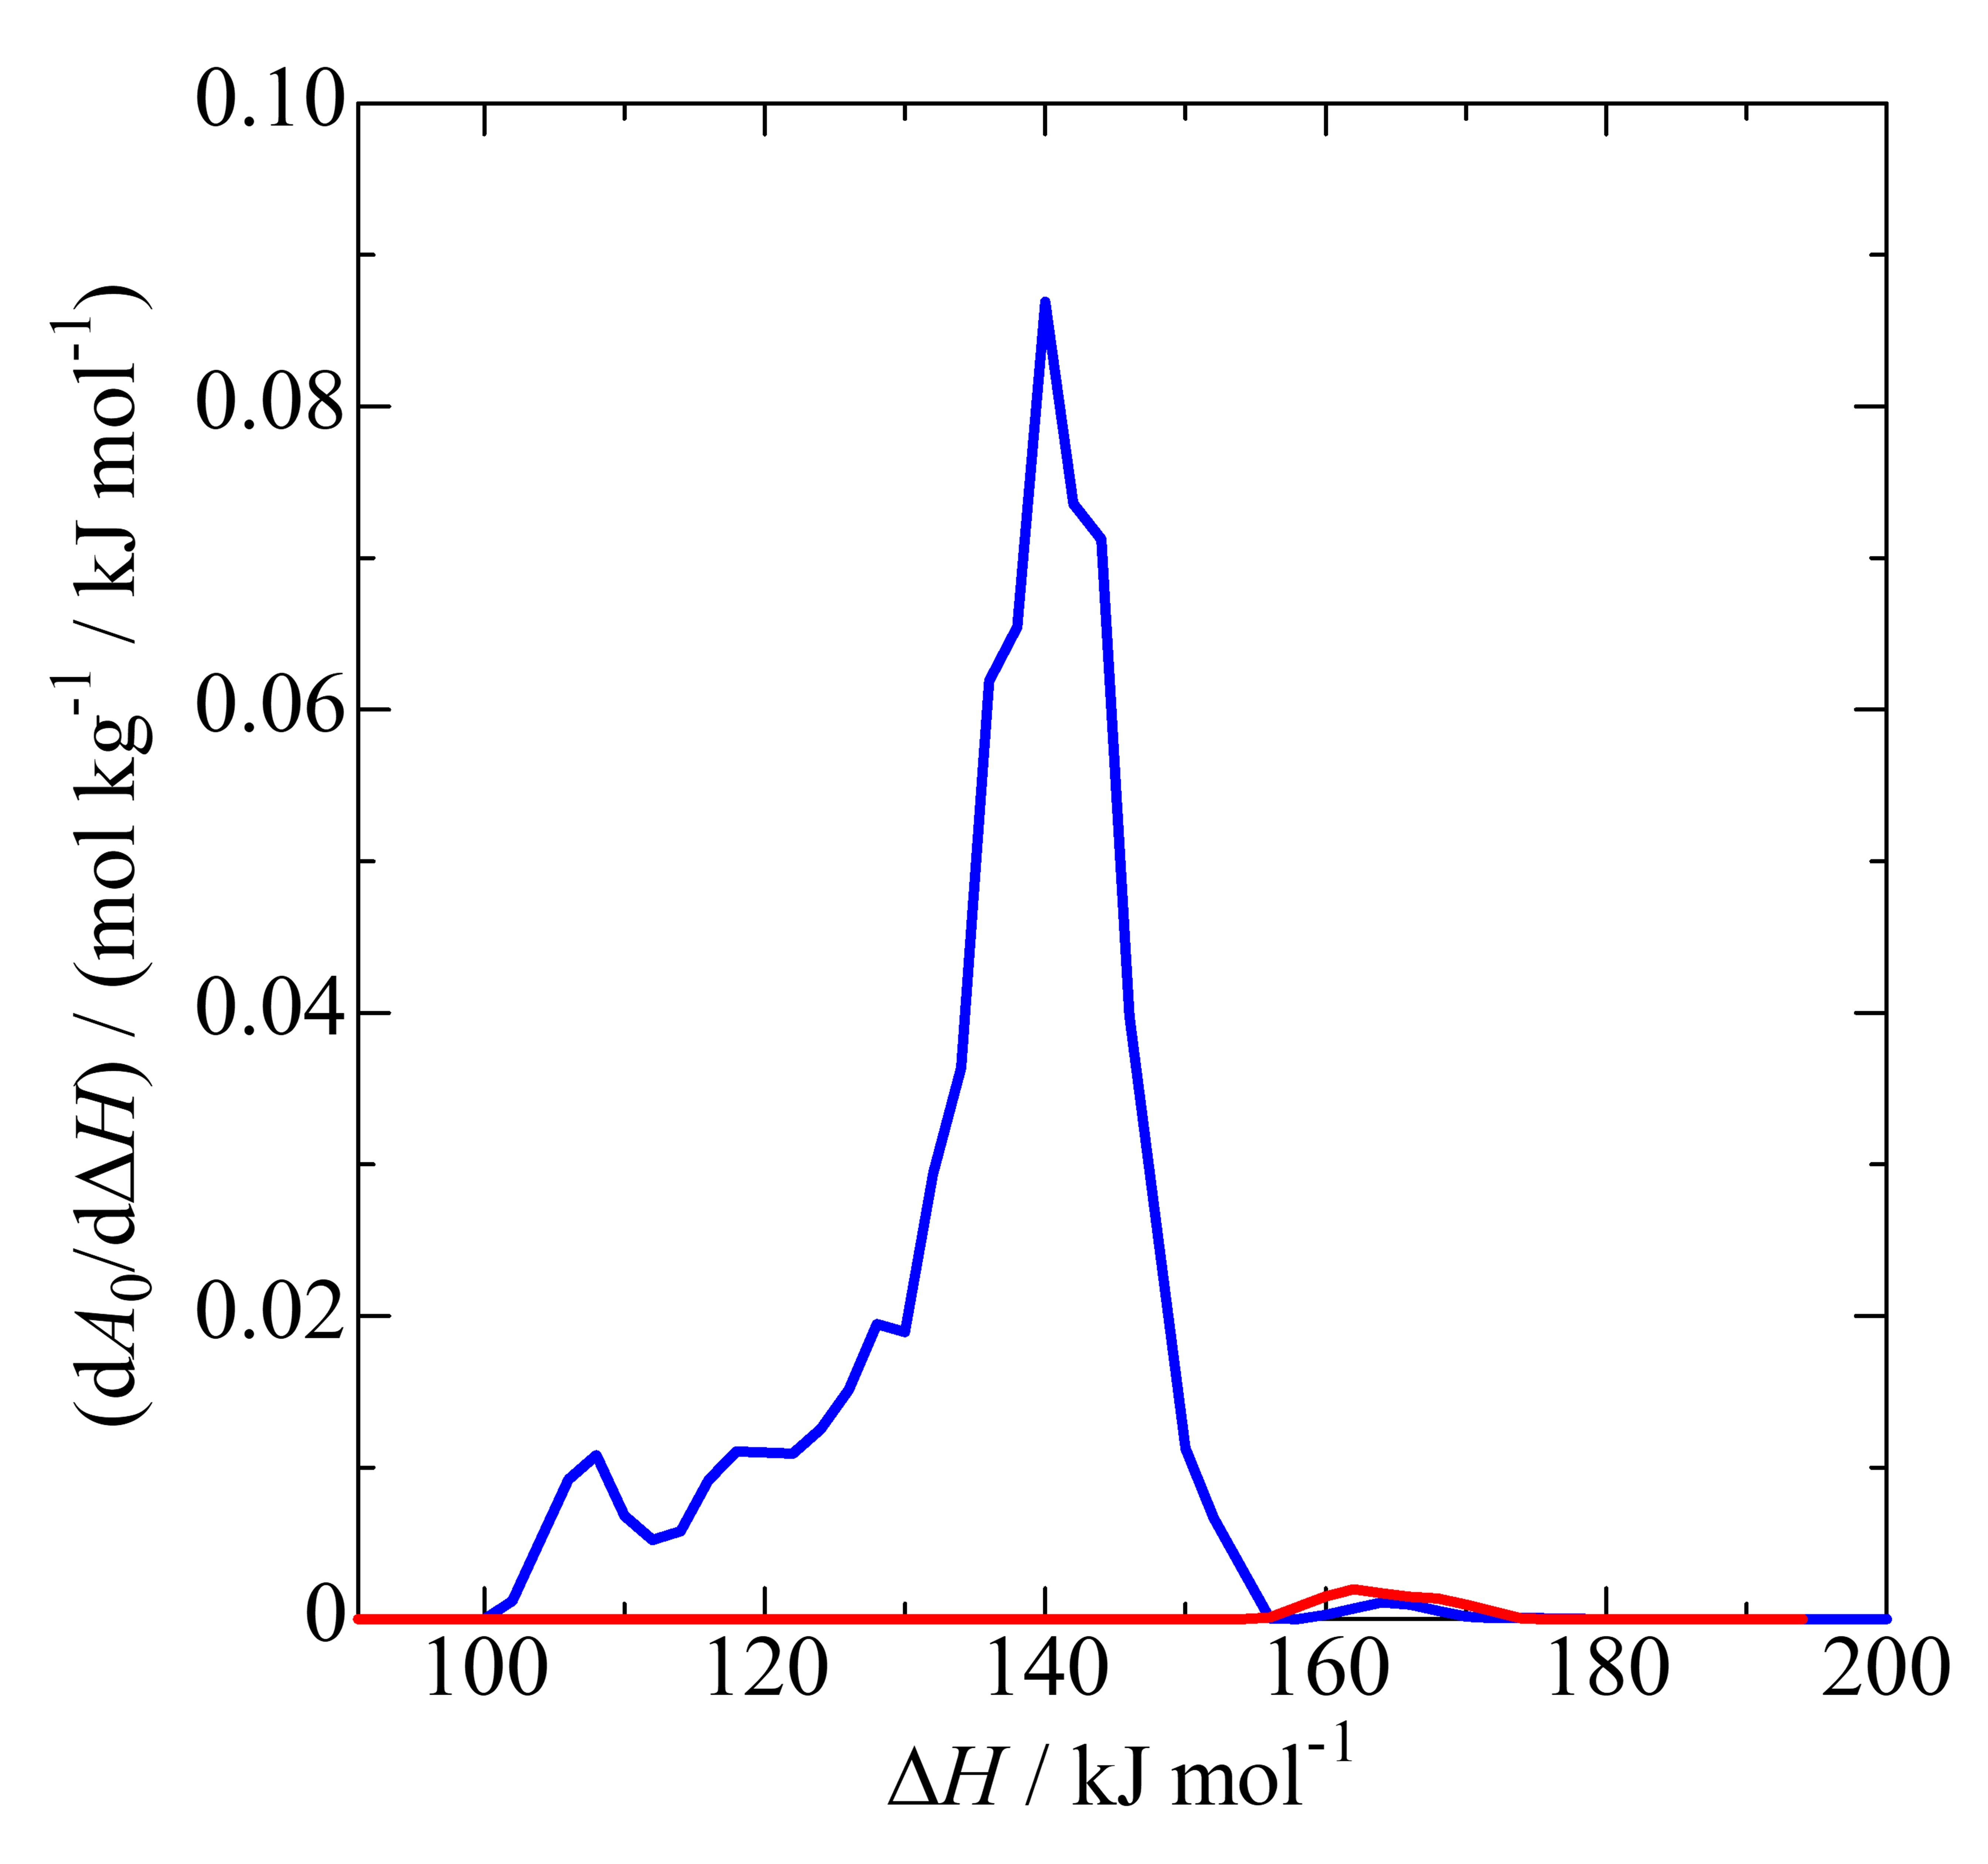
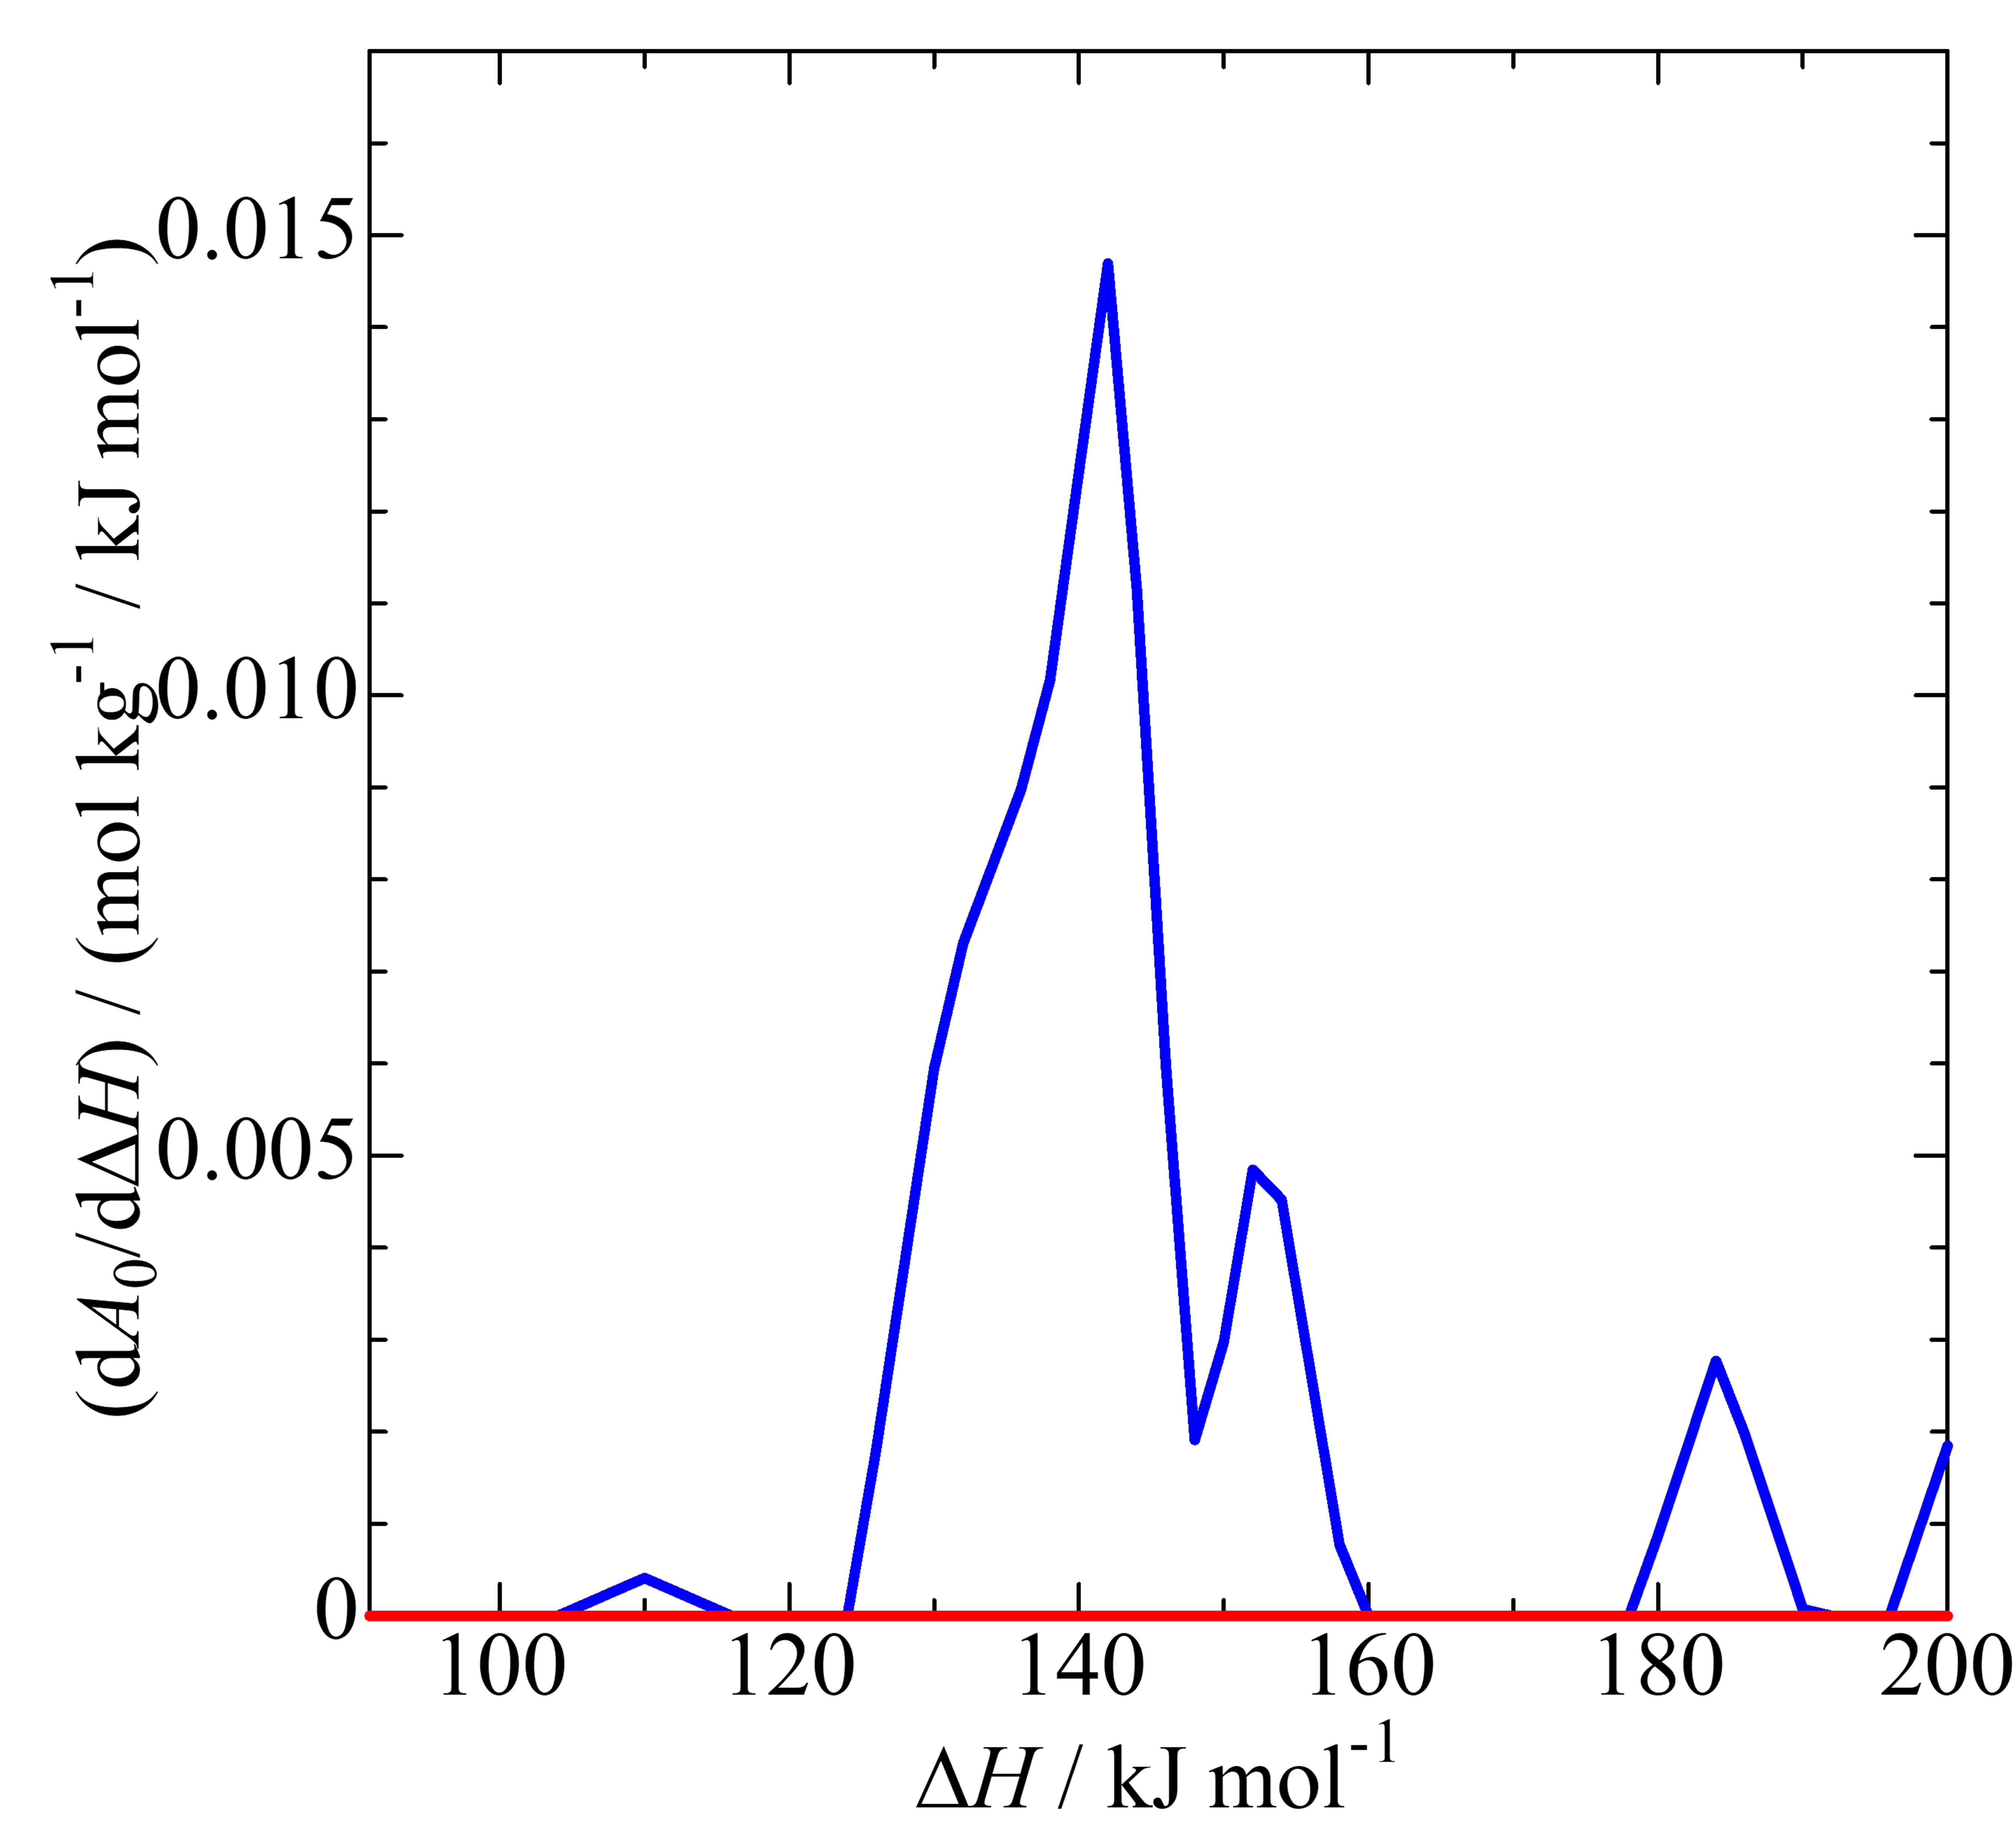
Distribution of enthalpy of ammonia desorption from Brønsted (blue) and Lewis (red) acid sites. The plots was modified with smoothing.
IRZ-FAU001
Click to get a high resolution picture
Click to get a data table (0.01 MB)
IRZ-MFI001
Click to get a high resolution picture
Click to get a data table (0.01 MB)
IRZ-MFI002
Click to get a high resolution picture
Click to get a data table (0.01 MB)
IRZ-MFI003
Click to get a high resolution picture
Click to get a data table (0.01 MB)