Figure 6
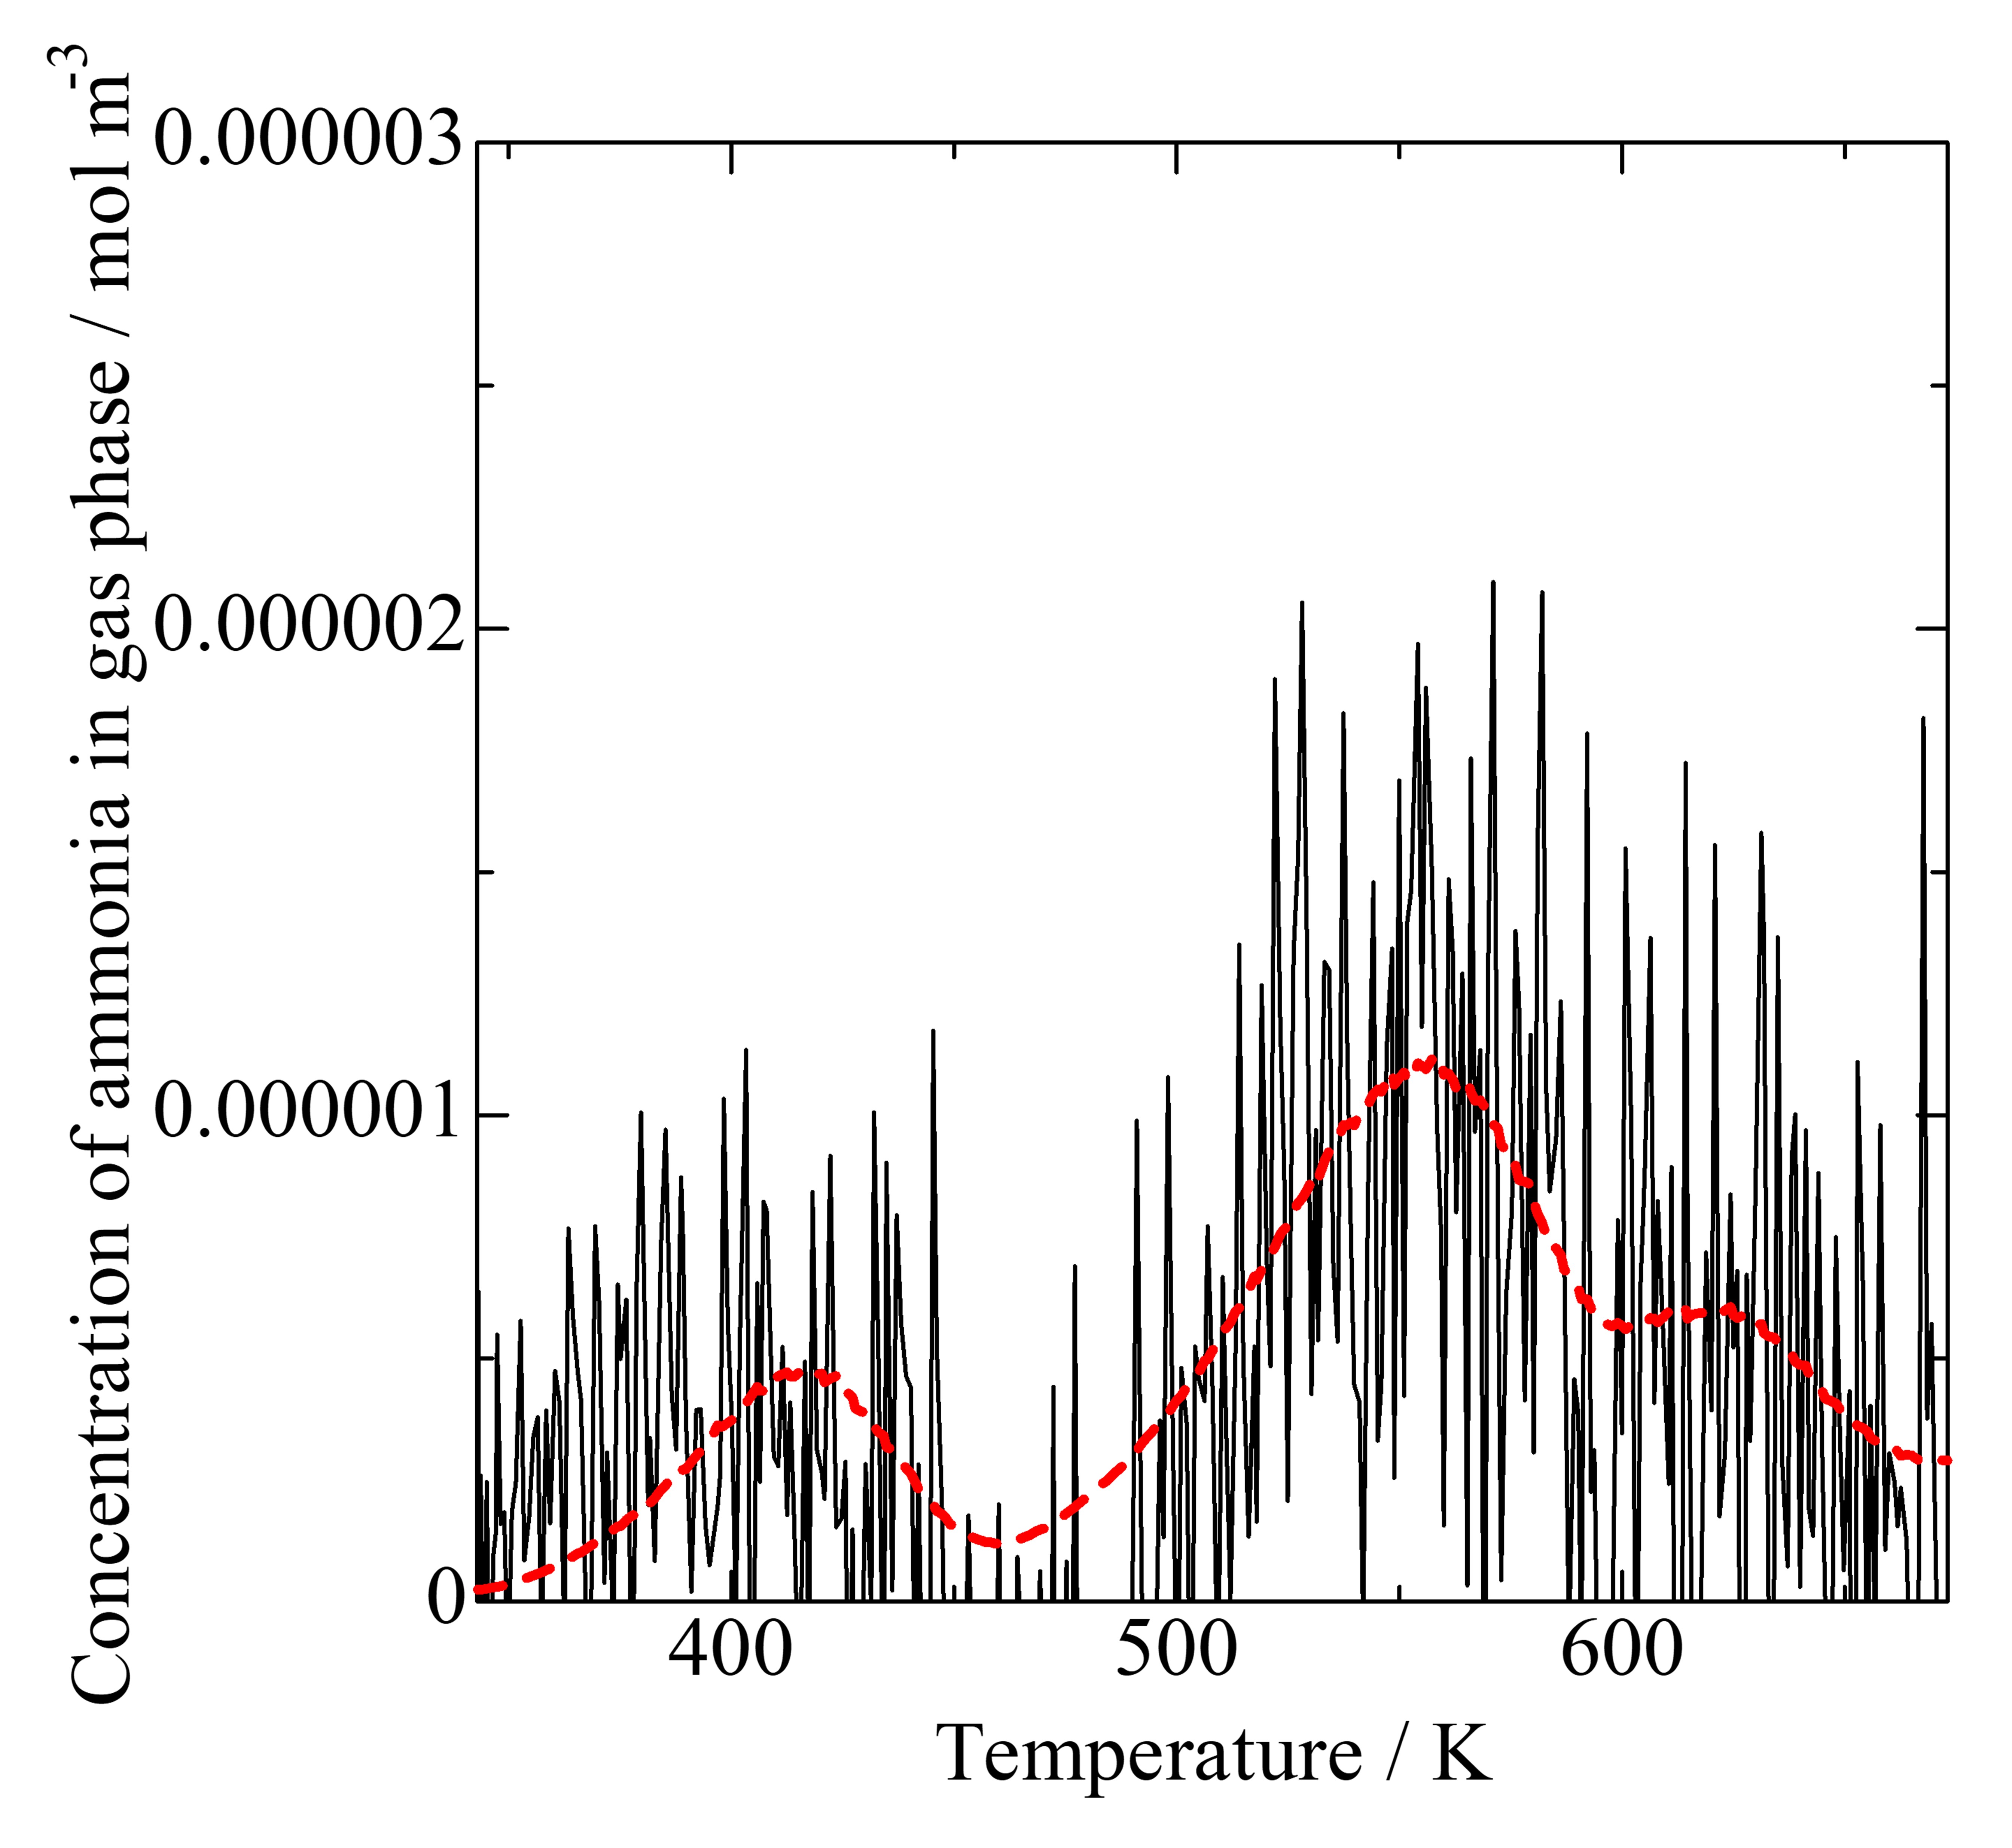
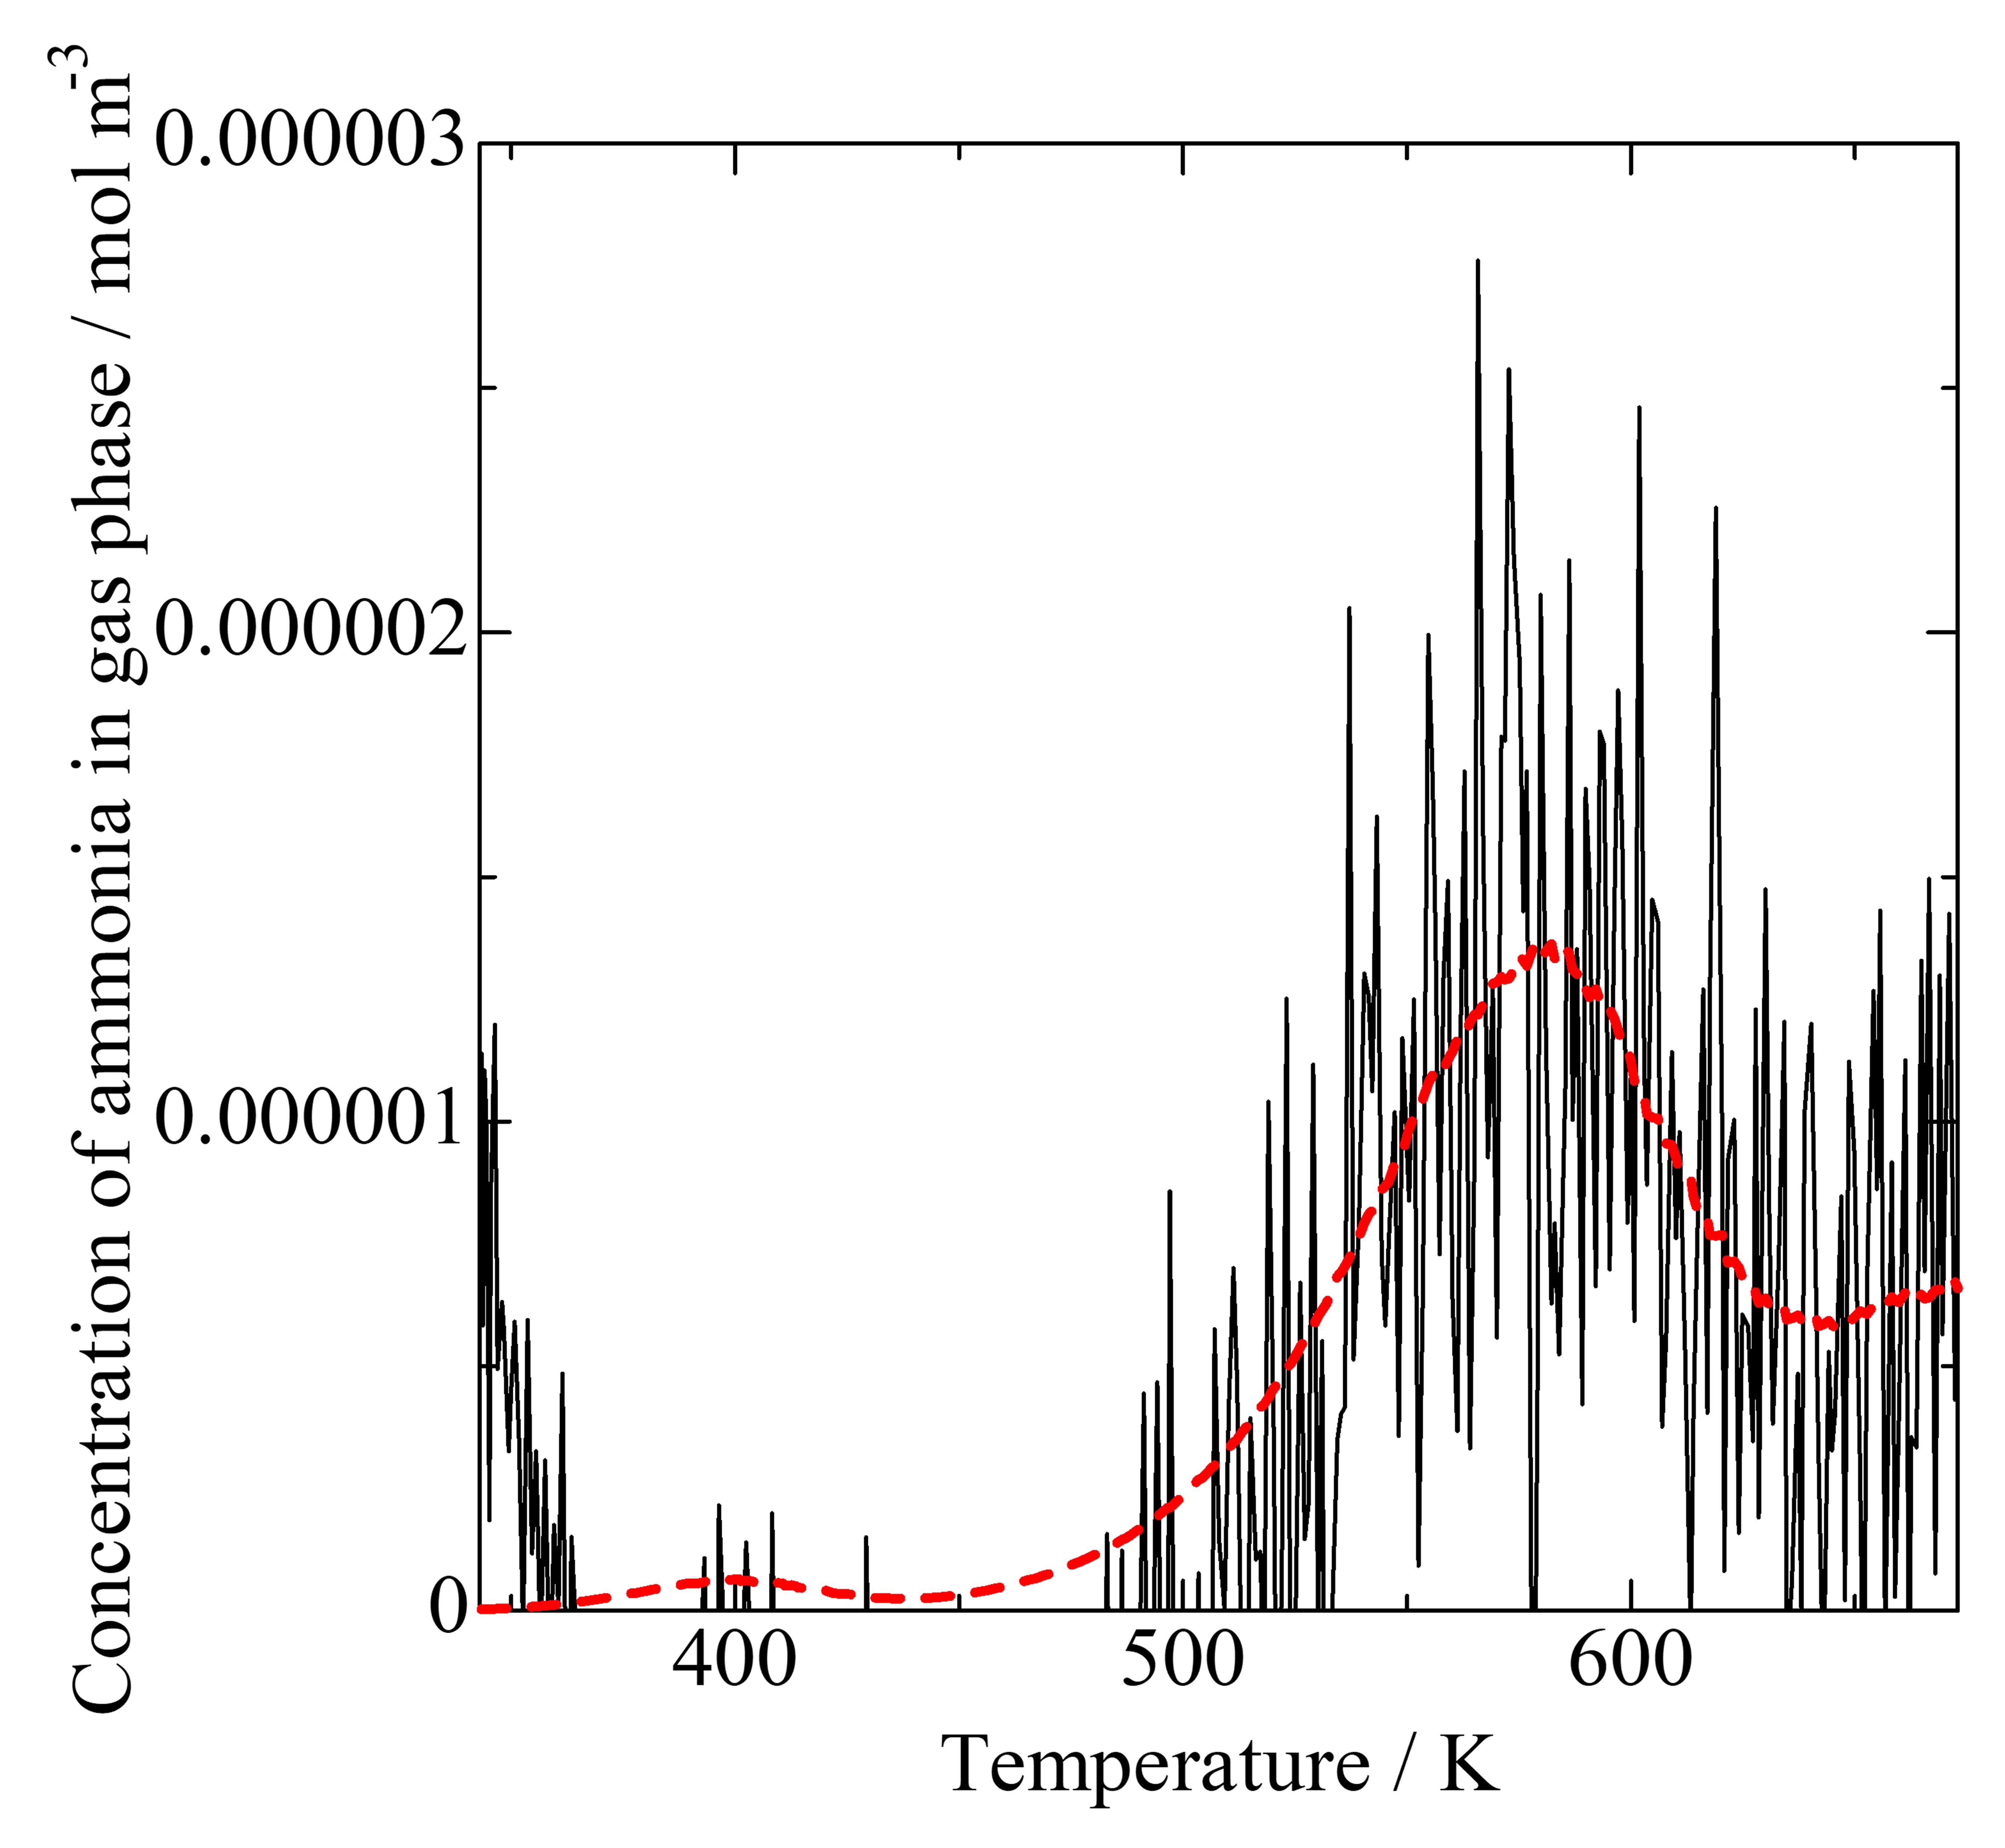
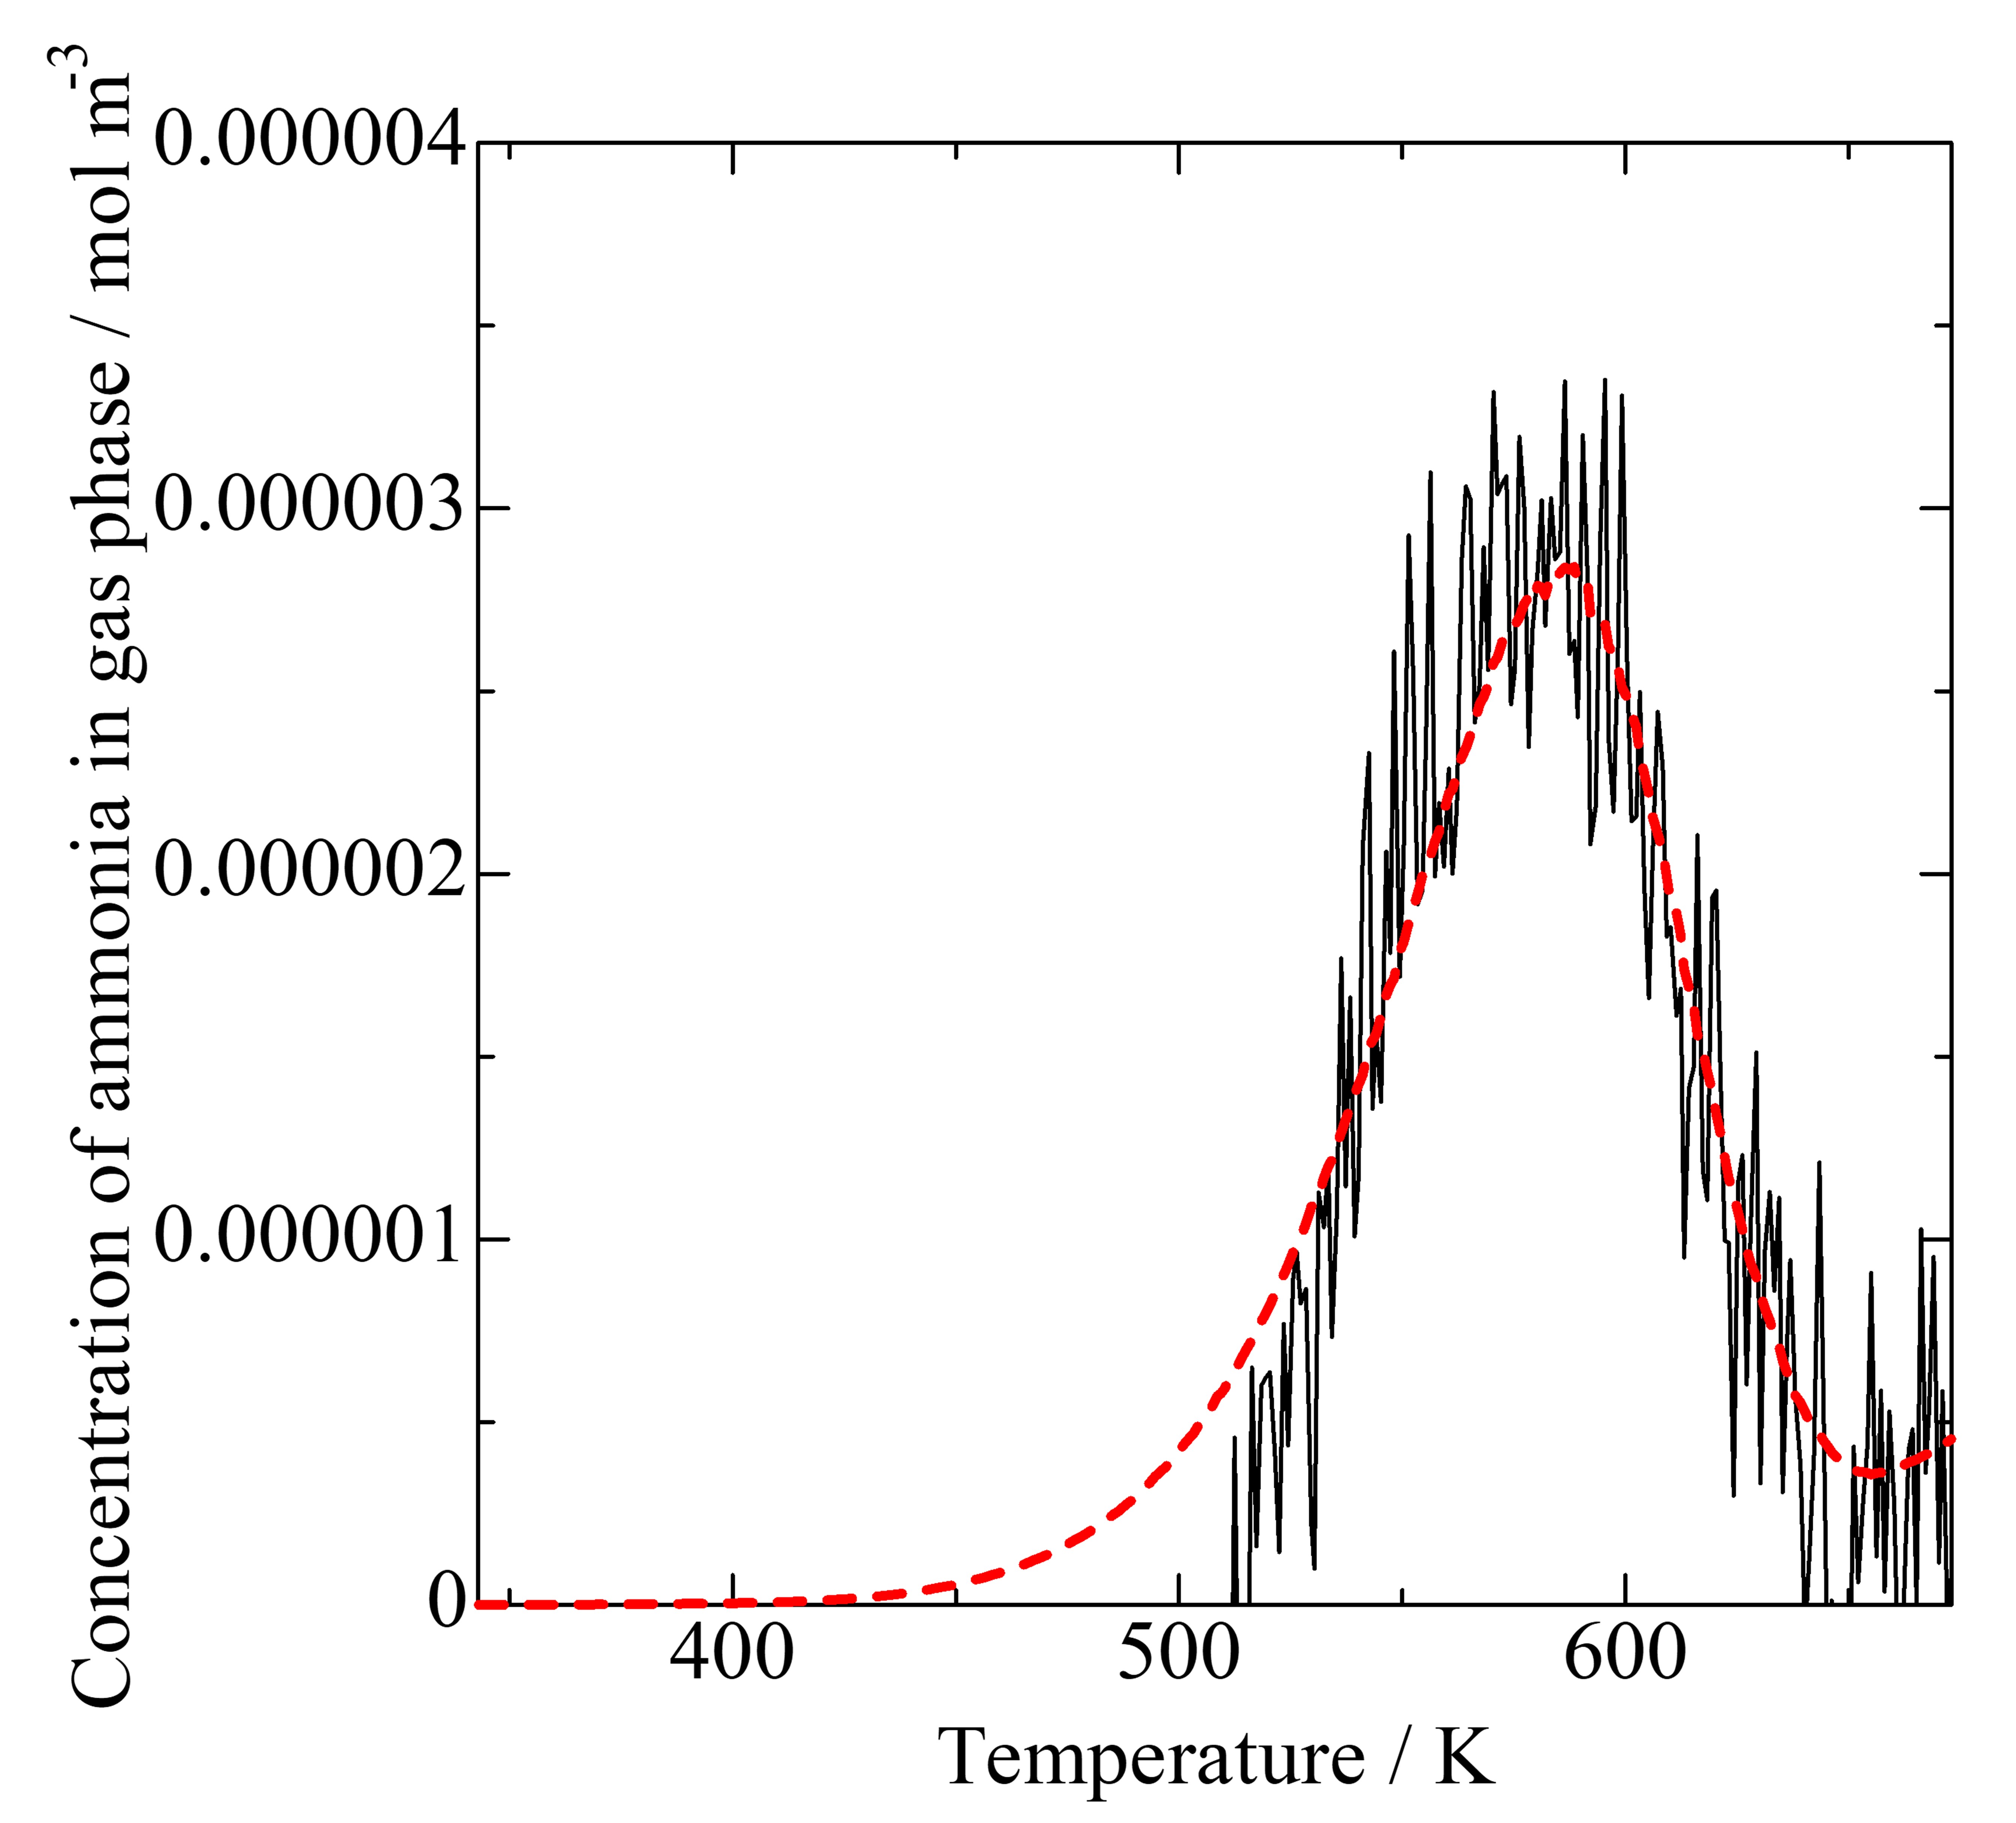
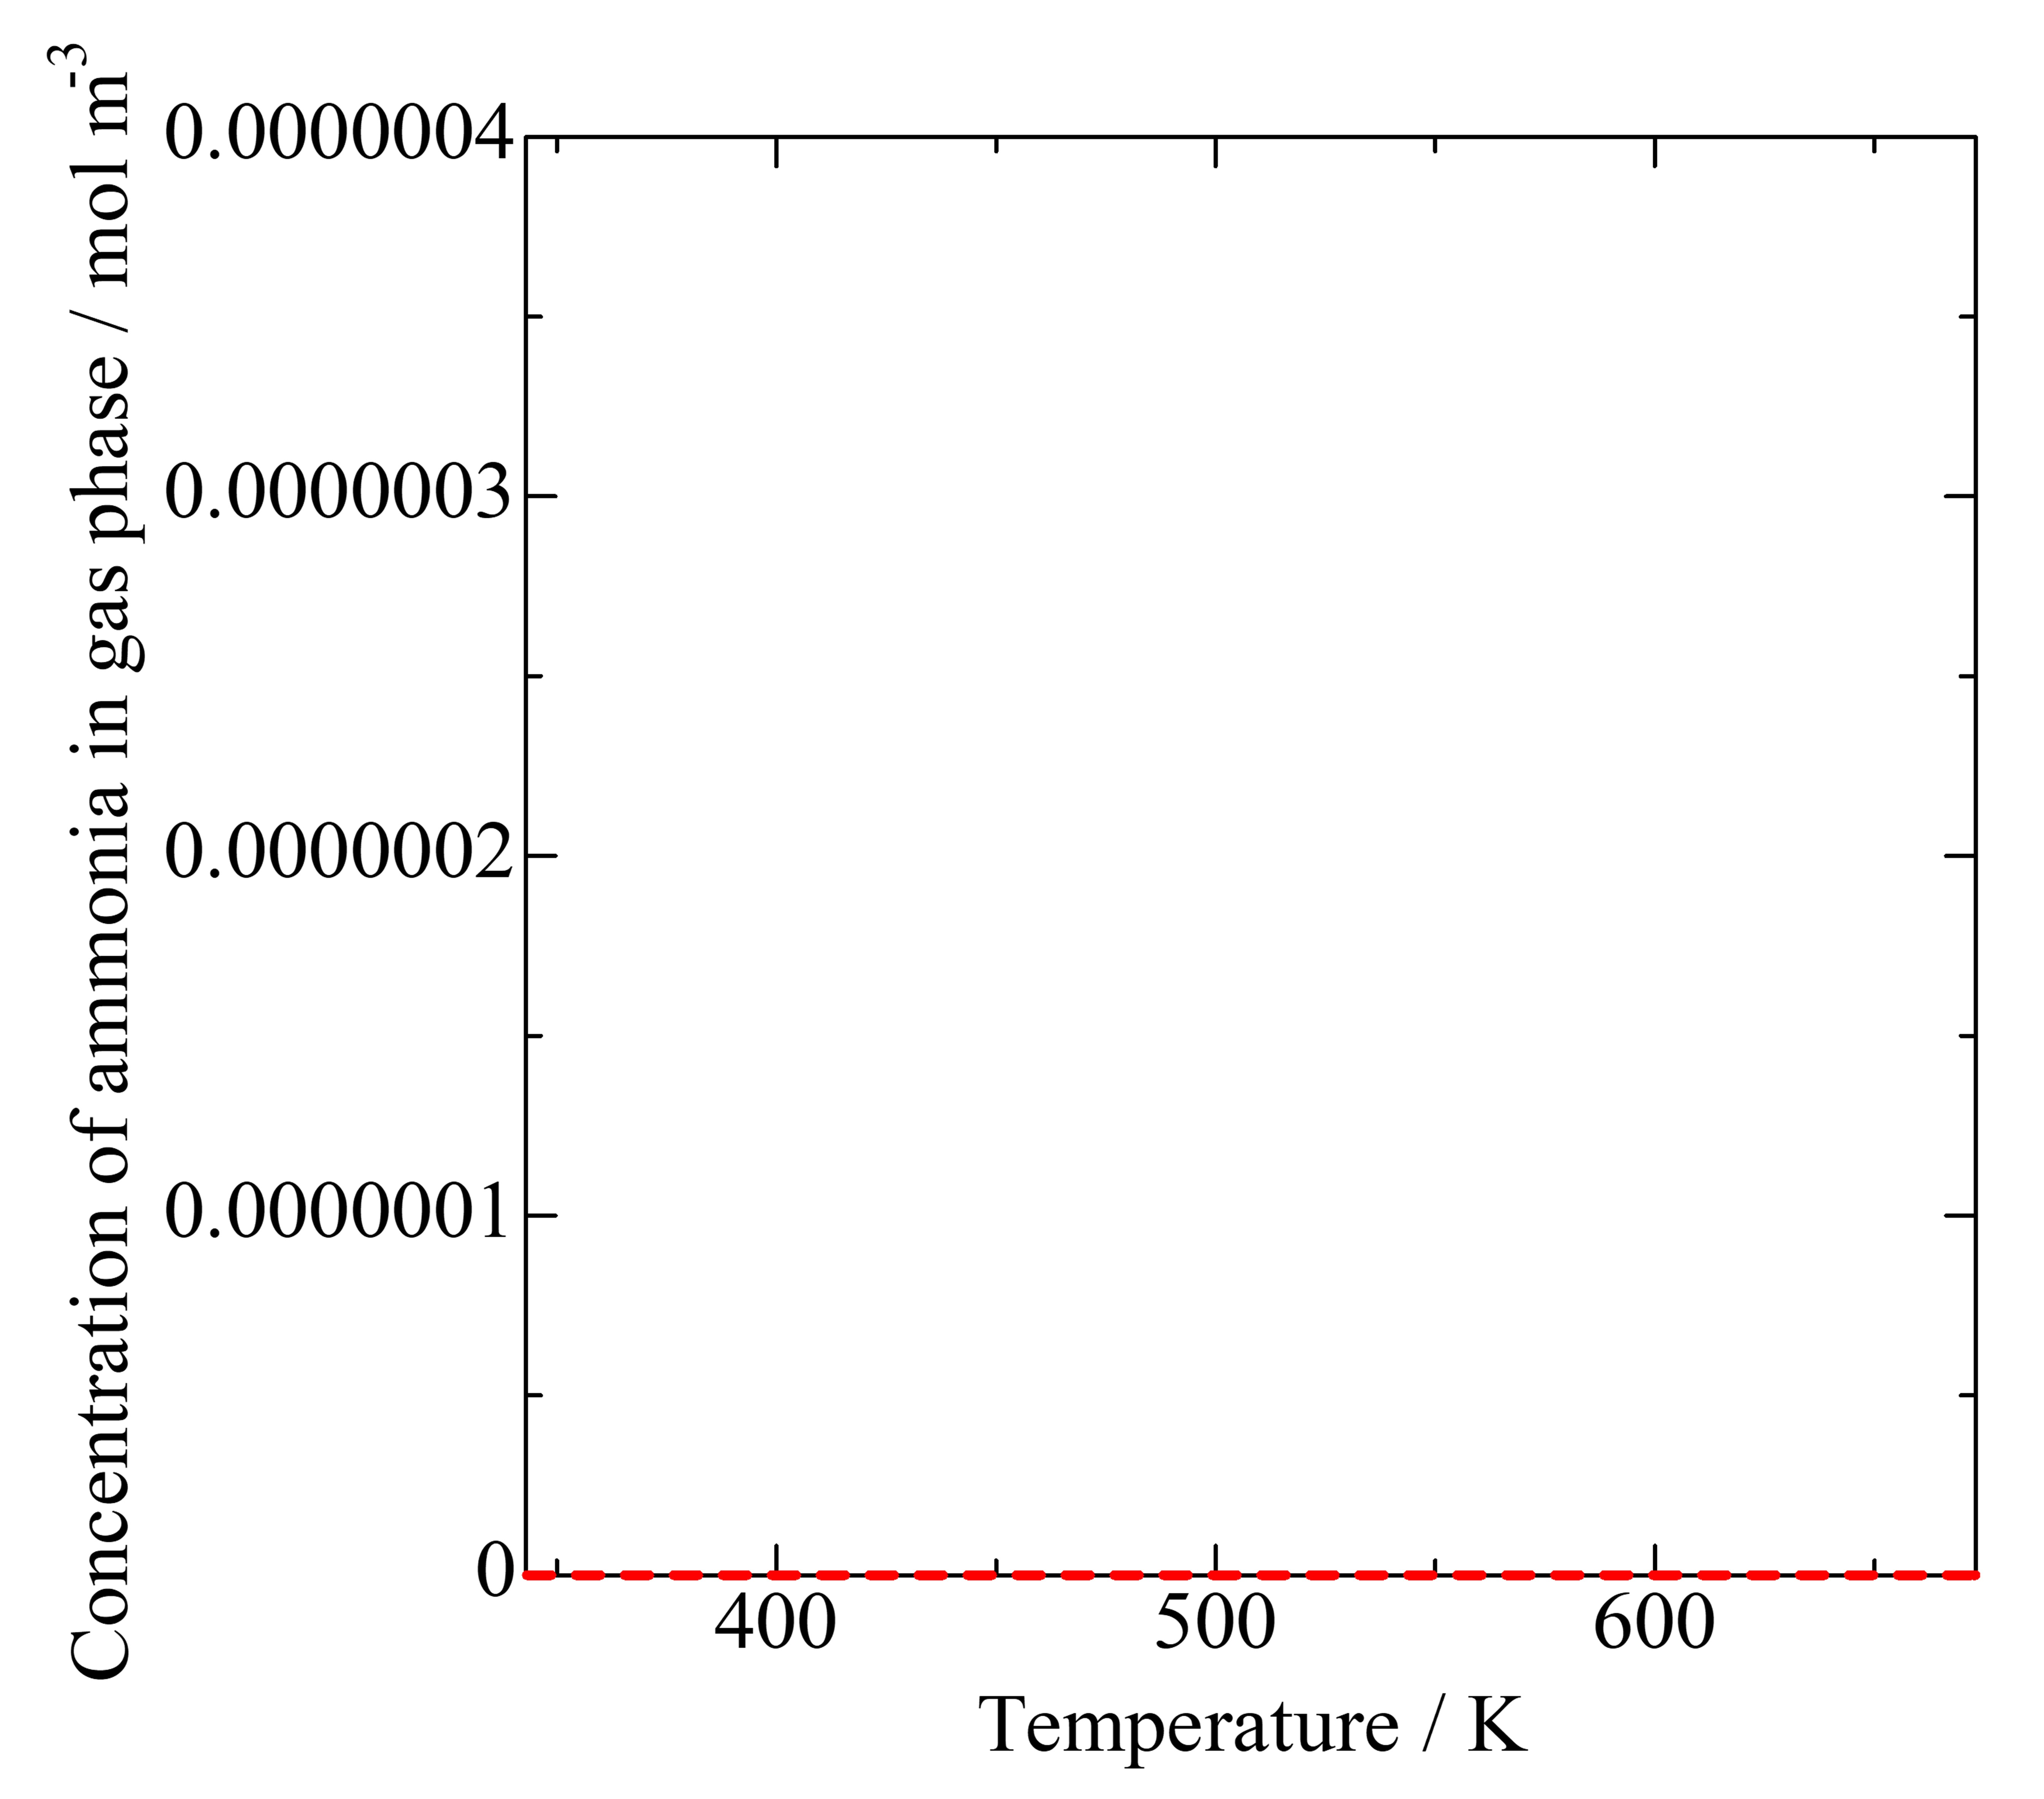
Ammonia TPD profiles of Lewis acid site observed (solid line) and simulated (dotted line) based on assumed distribution of desorption enthalpy.
IRZ-FAU001
Click to get a high resolution picture
Click to get a data table (0.04 MB)
IRZ-MFI001
Click to get a high resolution picture
Click to get a data table (0.04 MB)
IRZ-MFI002
Click to get a high resolution picture
Click to get a data table (0.04 MB)
IRZ-MFI003
Click to get a high resolution picture
Click to get a data table (0.04 MB)