Figure 3
Deconvolution of symmetric deformation band of adsorbed species at 373 K. The thick black line shows the observed spectrum. The blue lines show the simulated band due ascribed to ν4 vibration of NH4 formed by the reaction between Brønsted acid site and ammonia. The red line shows the simulated band ascribed to δs vibration of NH3→Al species formed by the reaction between Lewis acid site and ammonia19. The dotted purple line showed the sum of simulated bands.
IRZ-FAU001
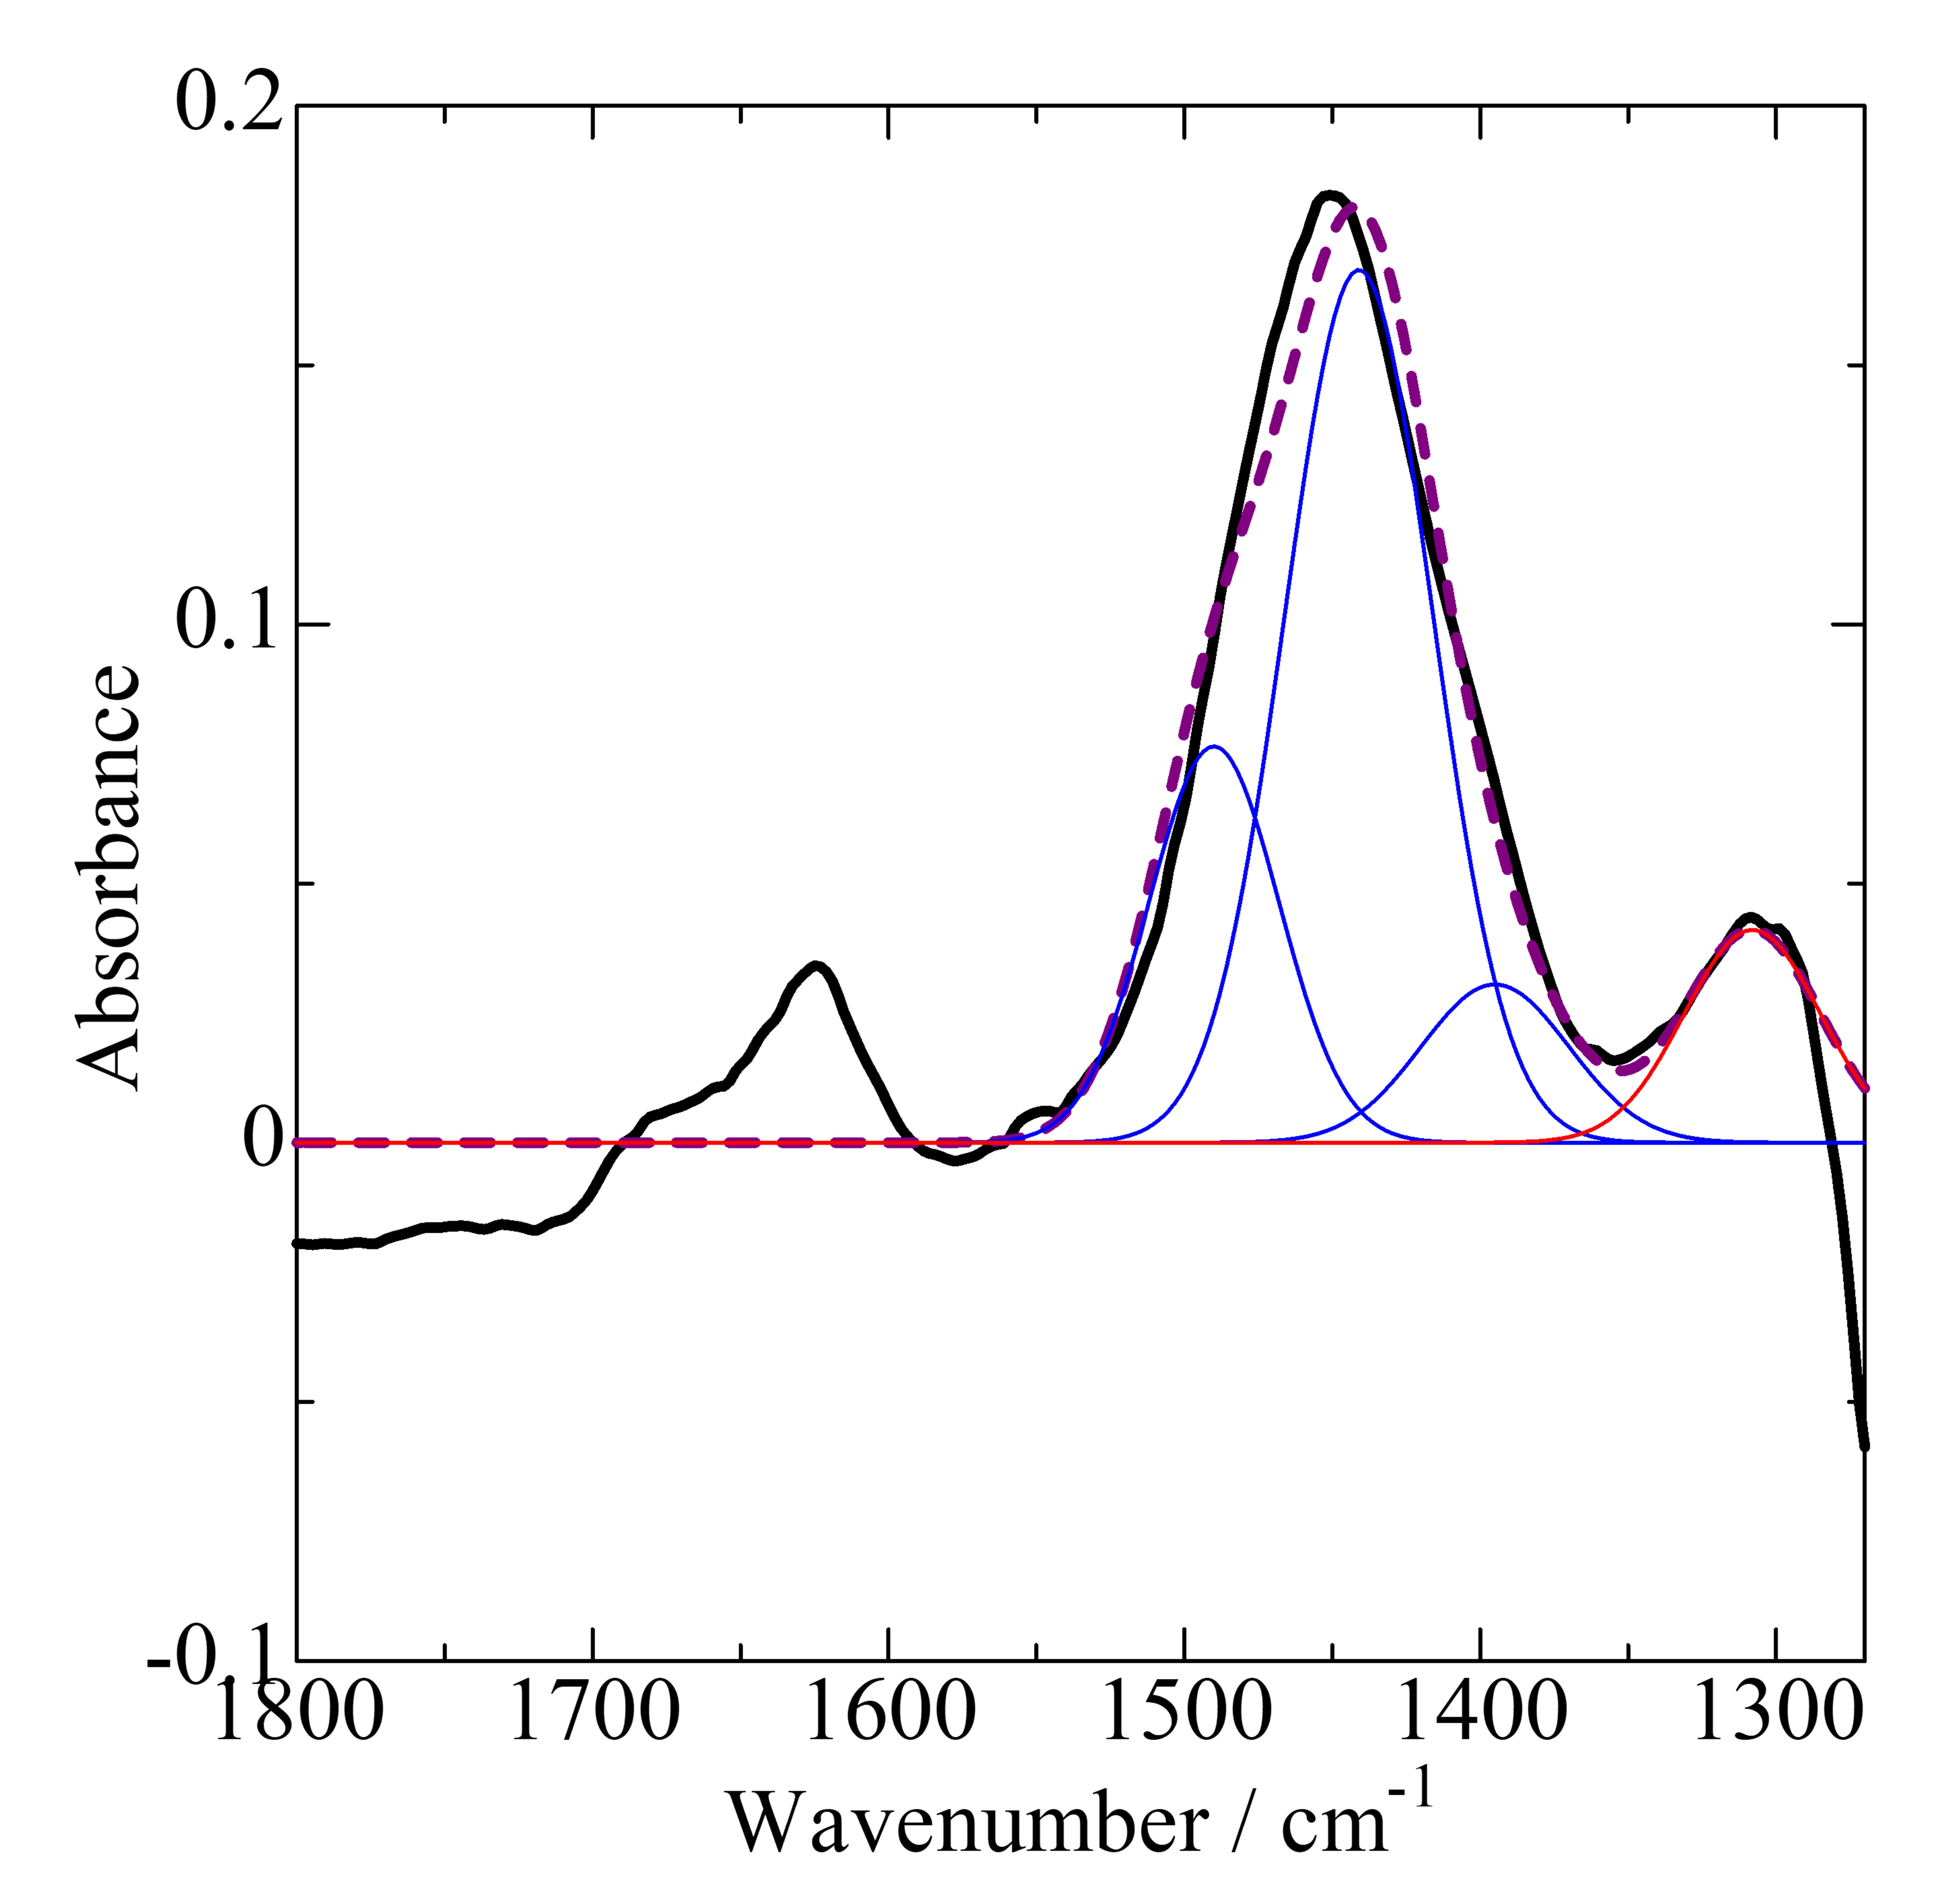
Click to get a high resolution picture
Click to get a data table (0.07 MB)
IRZ-MFI001
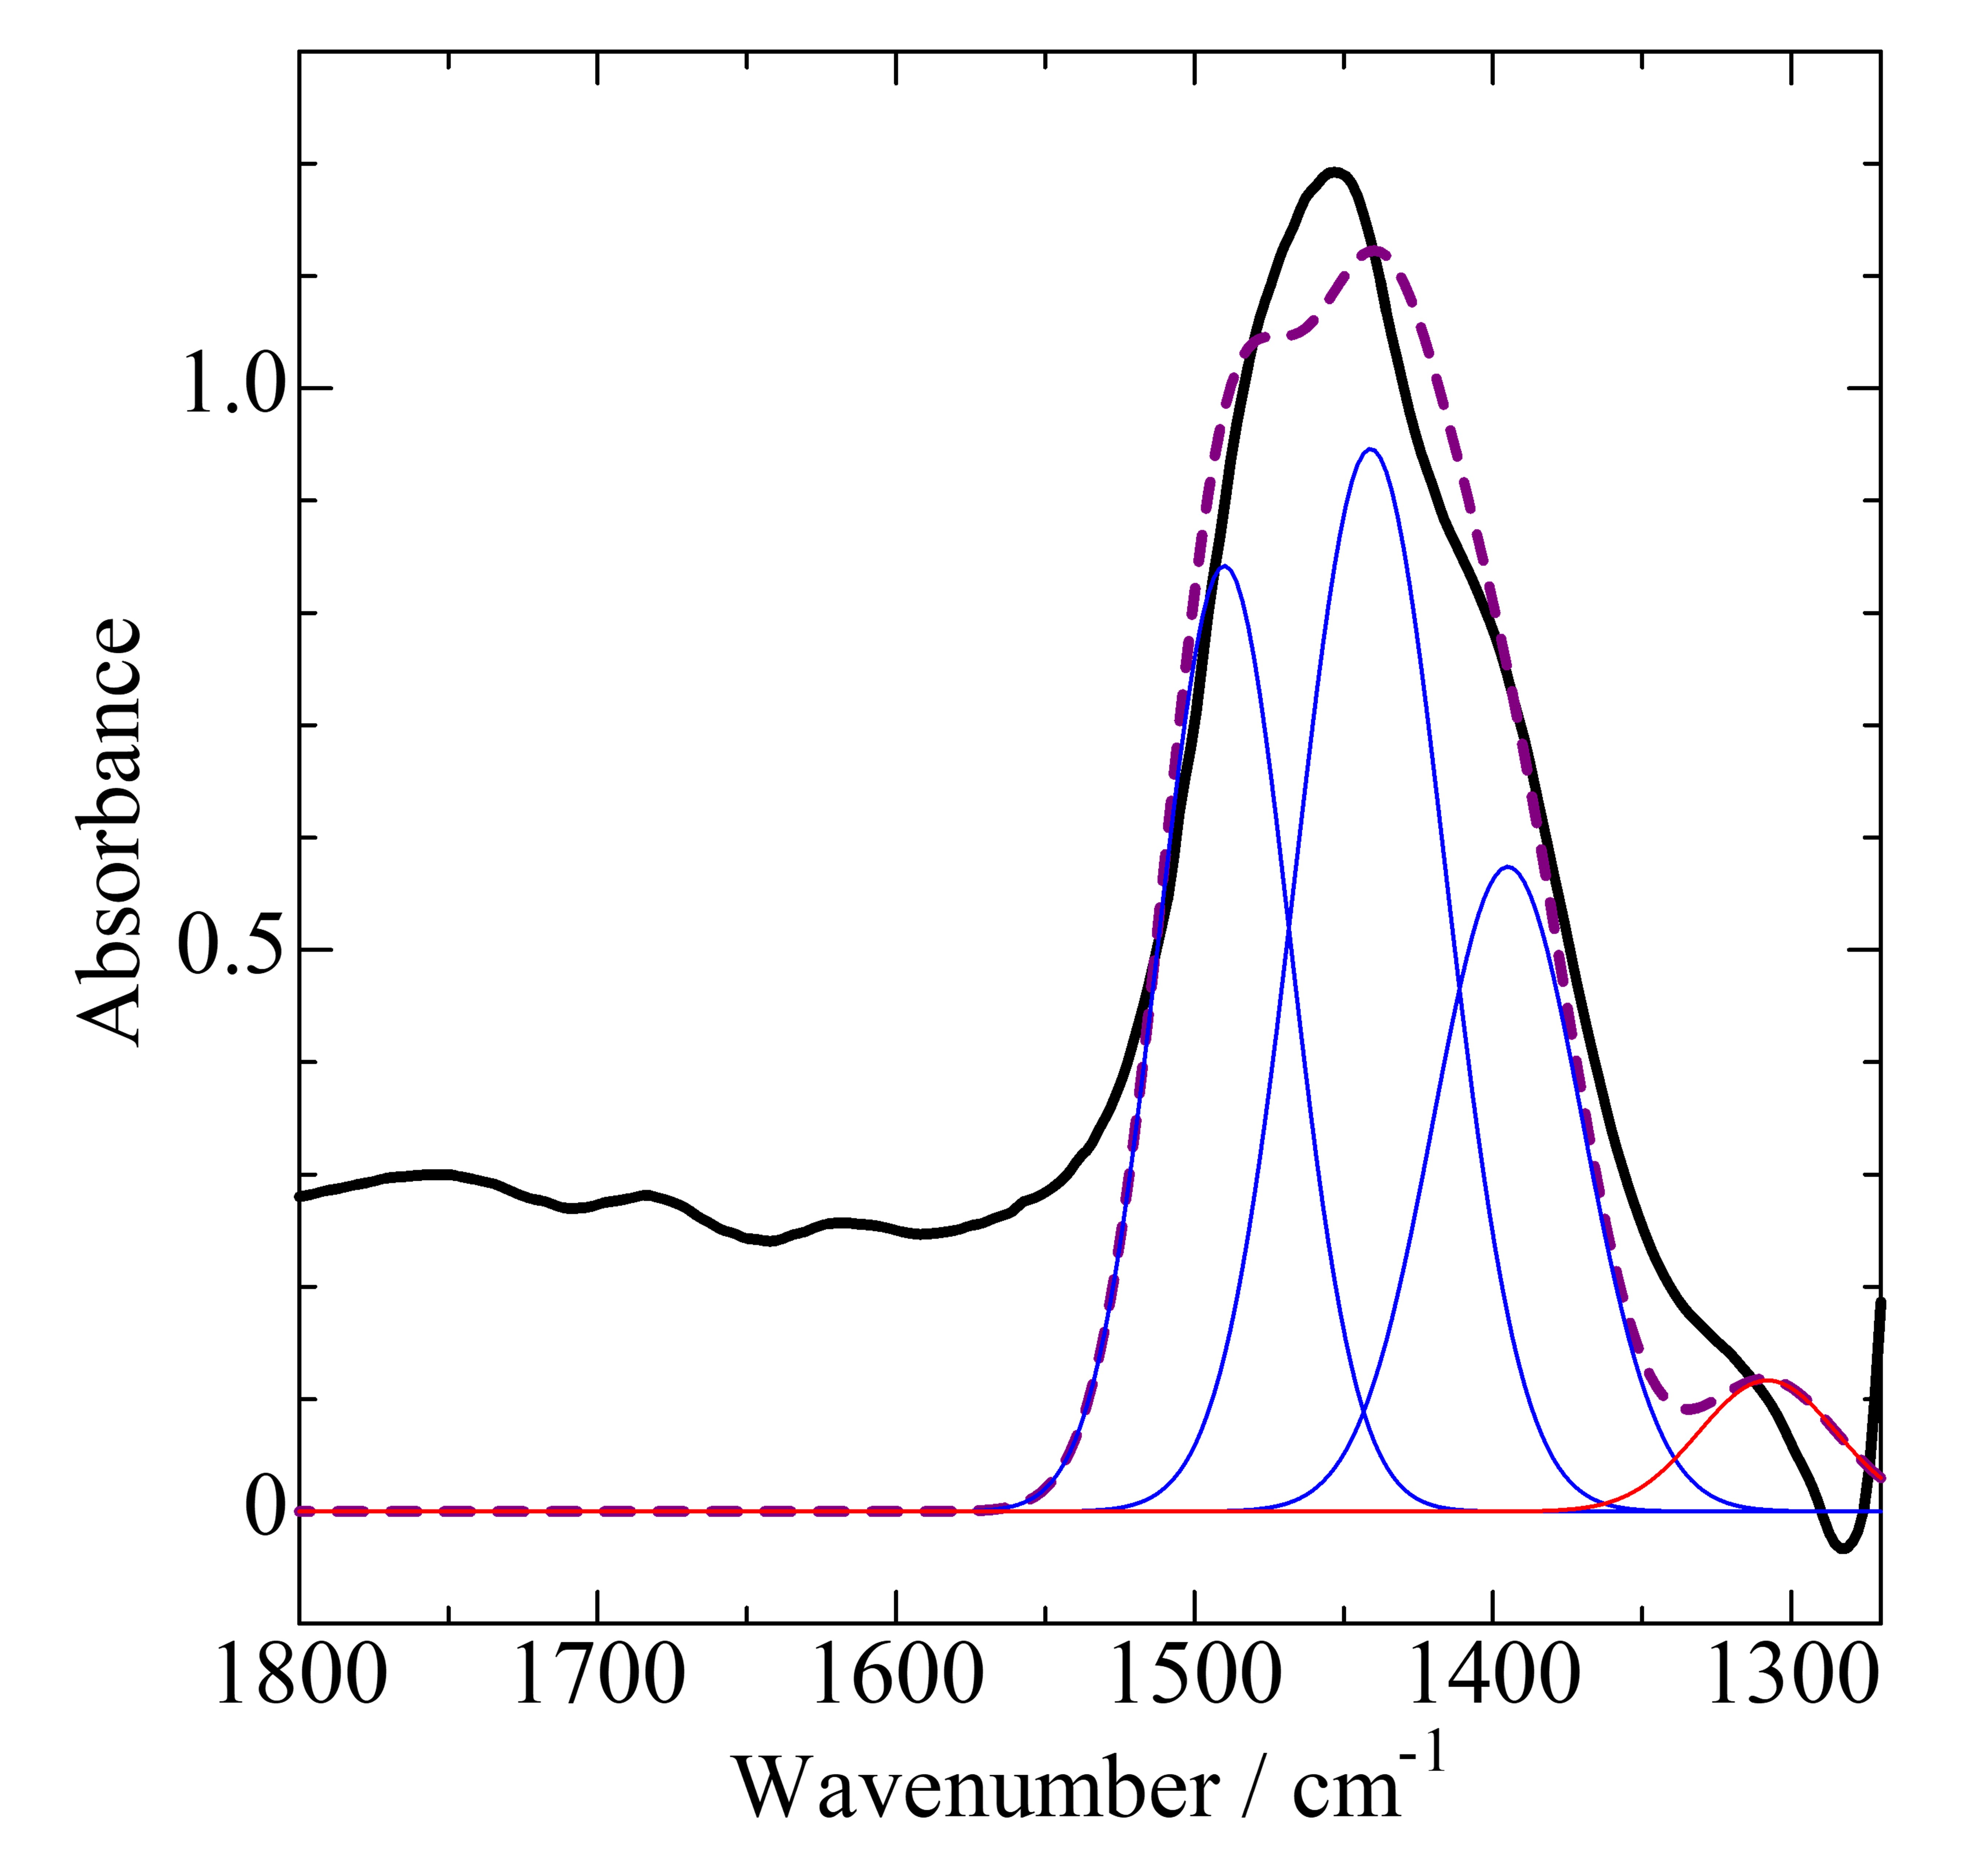
Click to get a high resolution picture
Click to get a data table (0.07 MB)
IRZ-MFI002
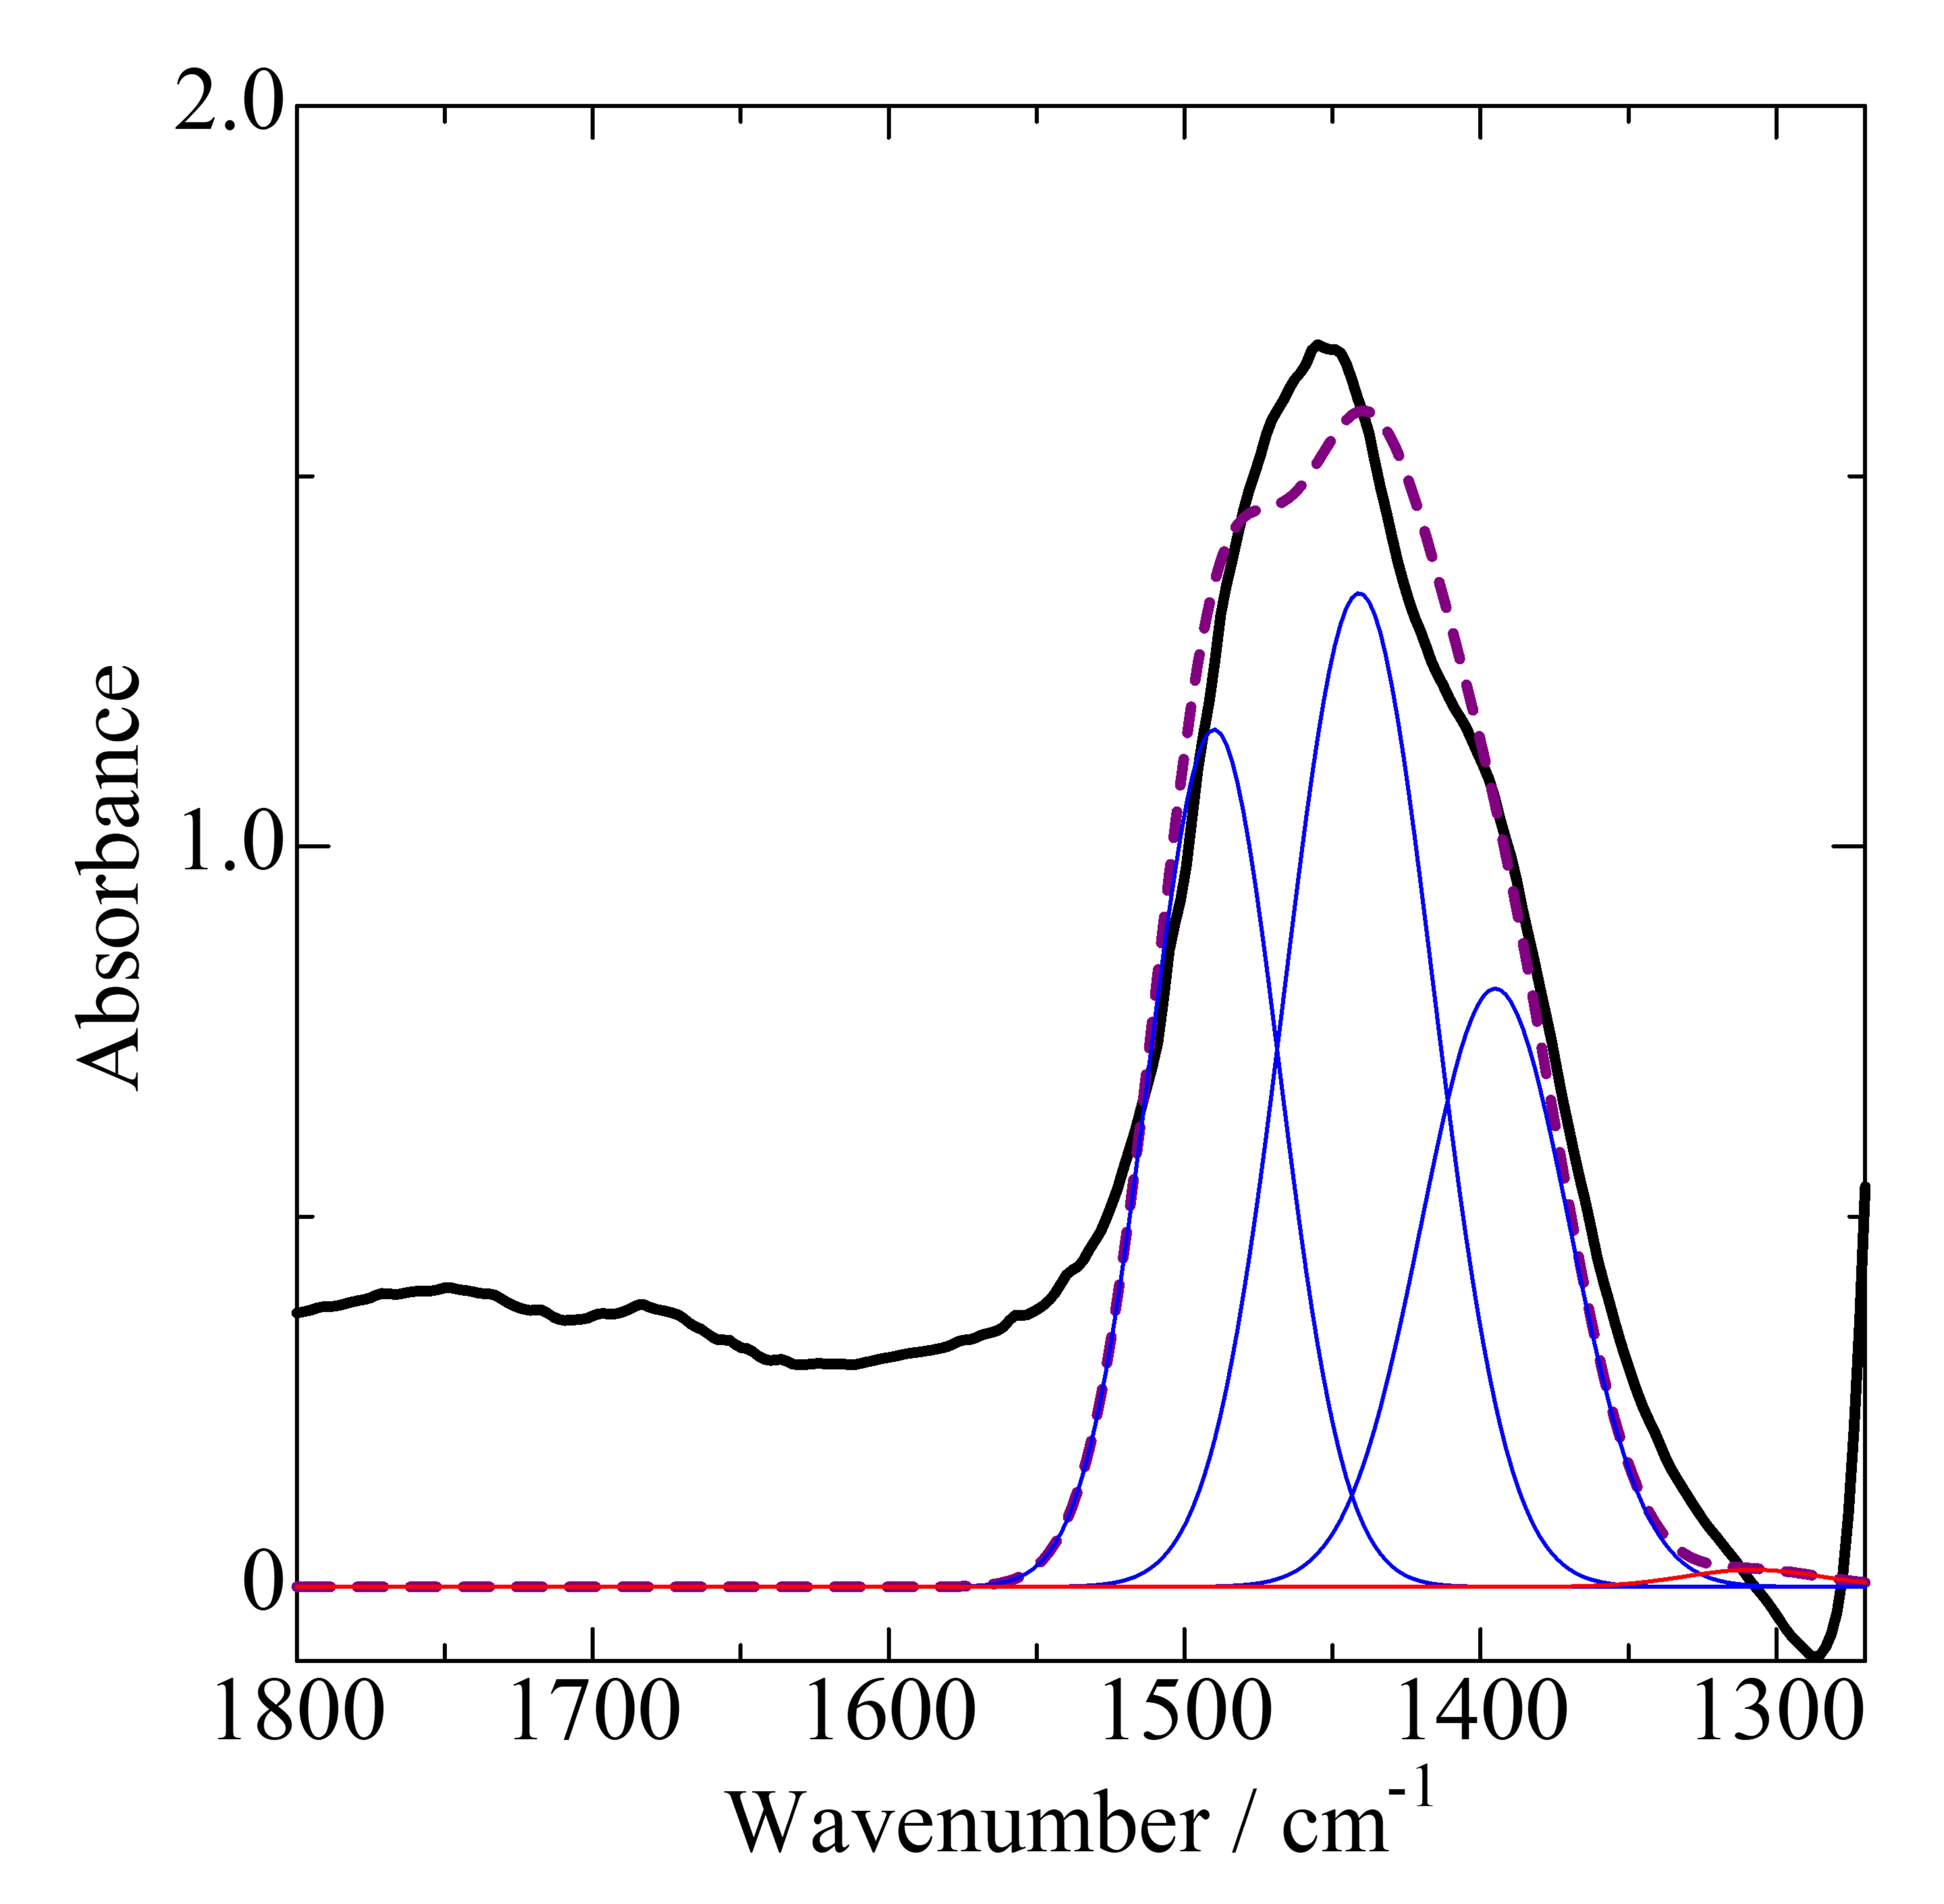
Click to get a high resolution picture
Click to get a data table (0.07 MB)
IRZ-MFI003
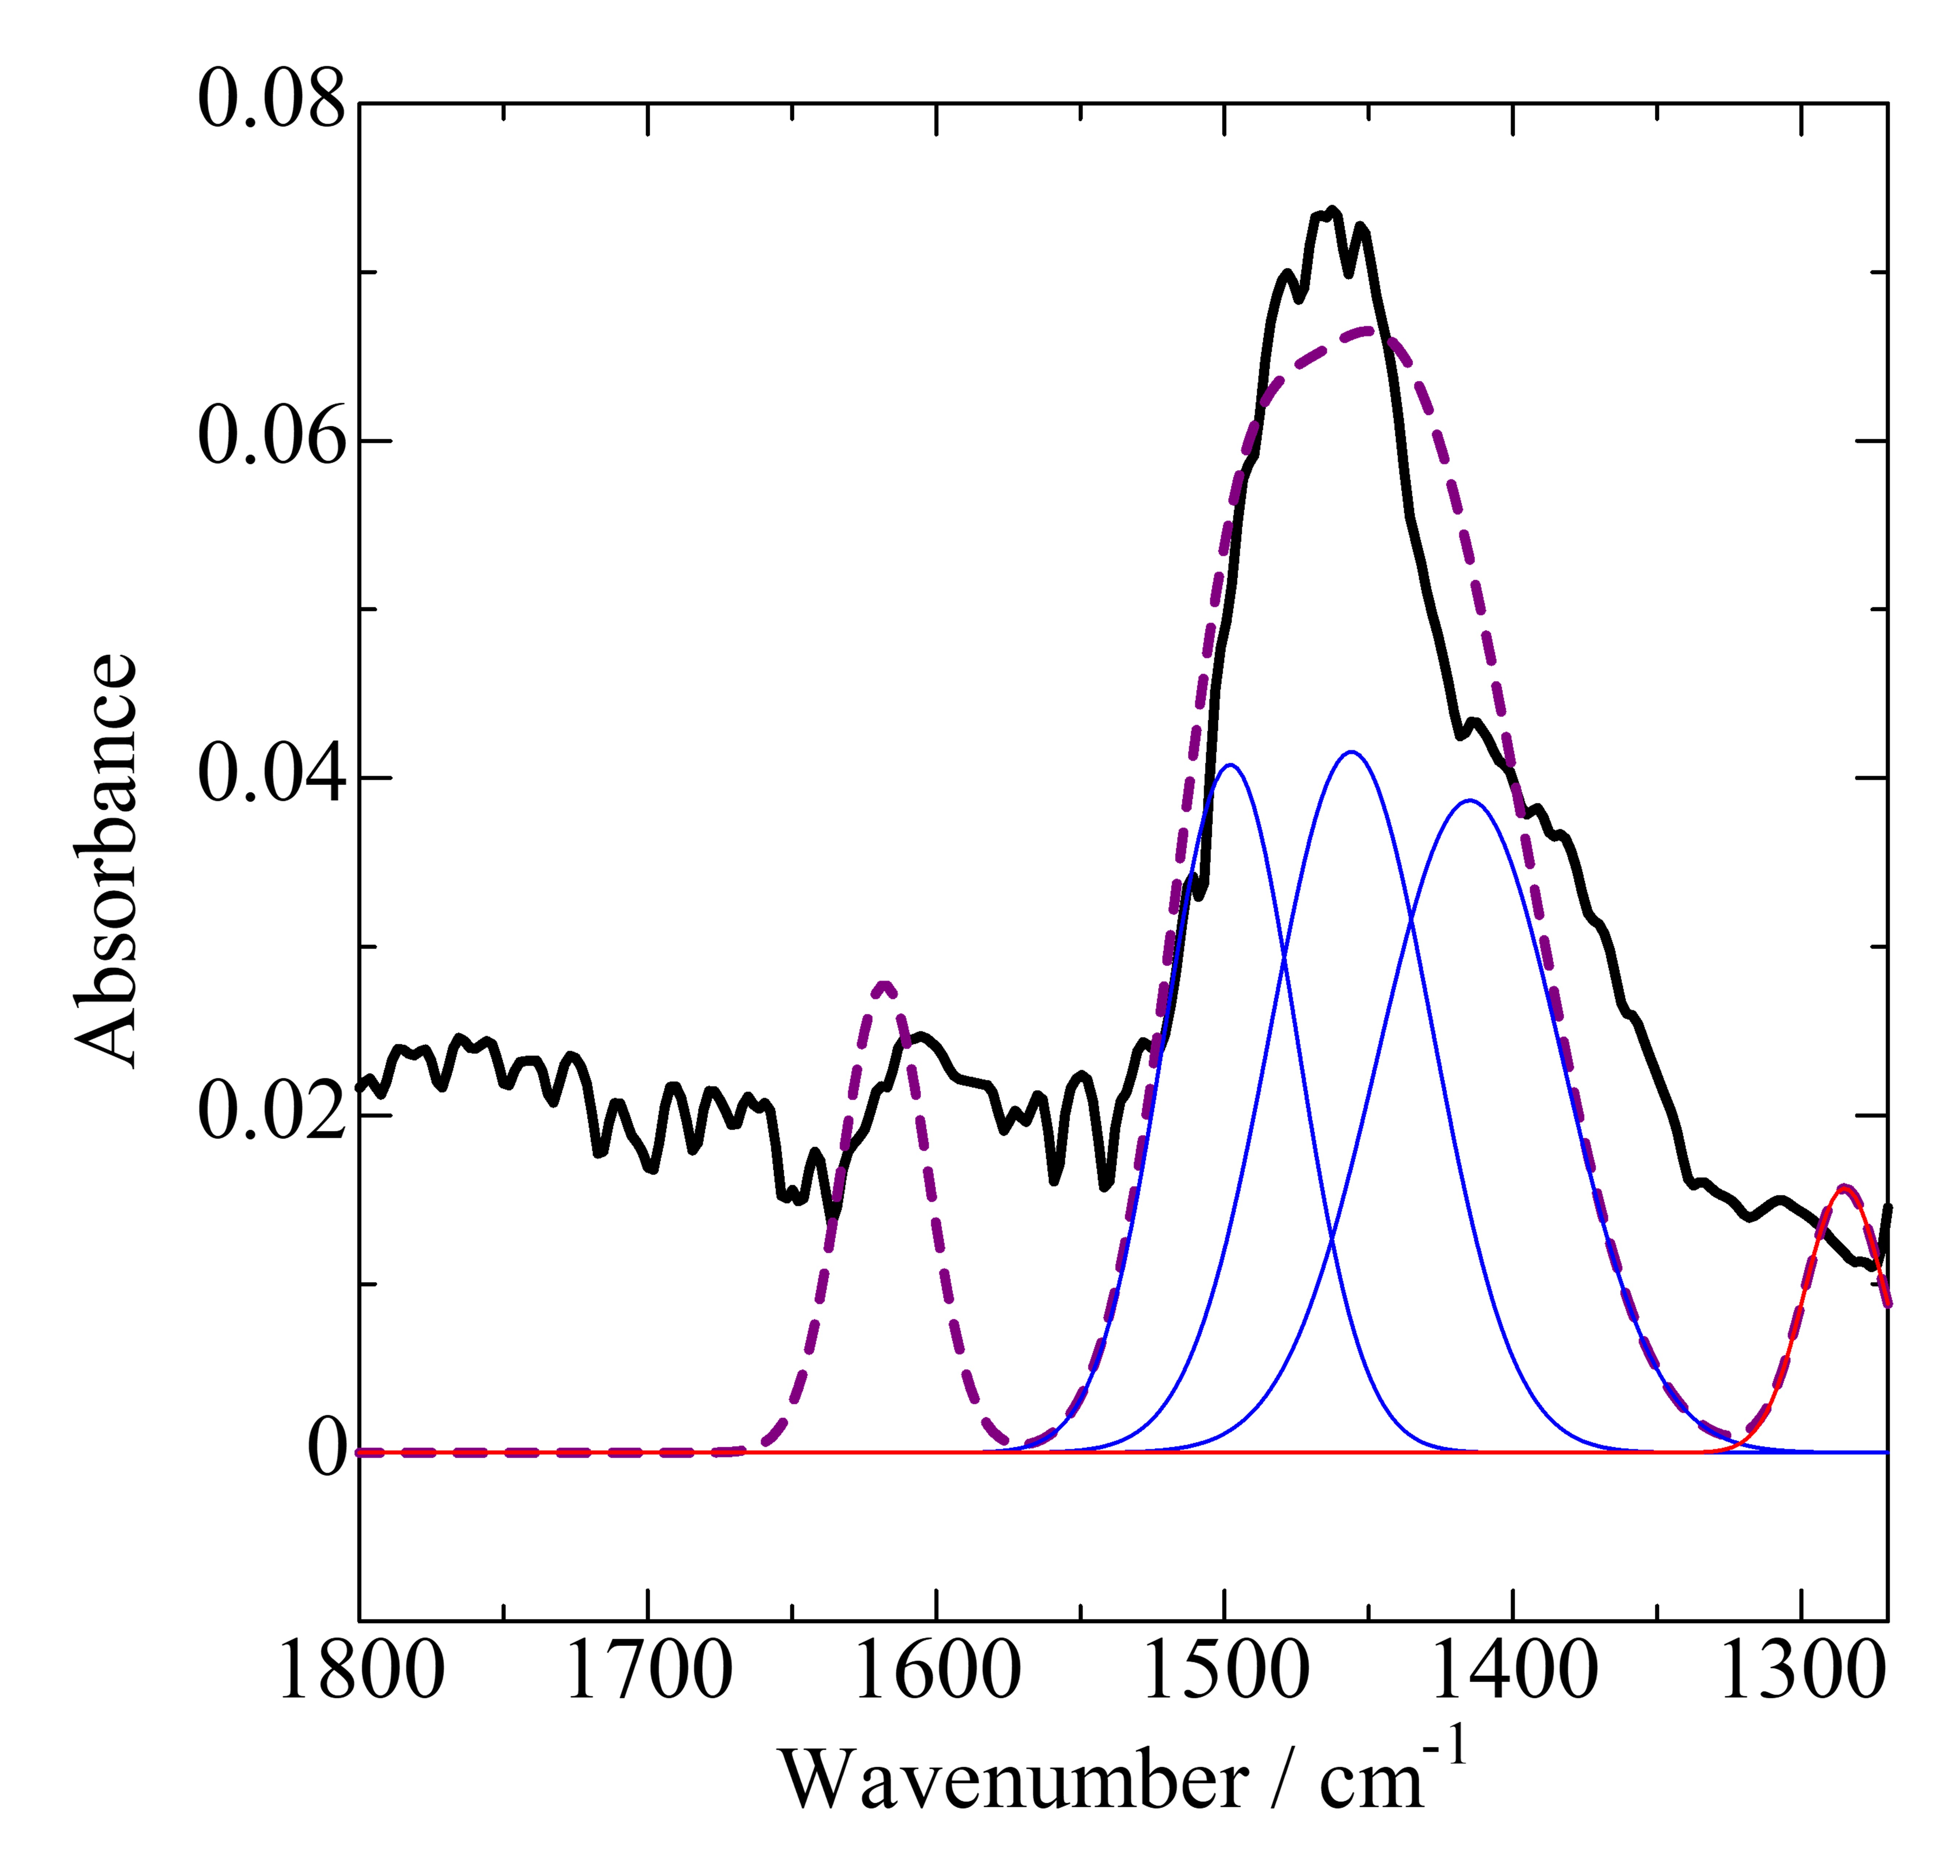
Click to get a high resolution picture
Click to get a data table (0.07 MB)